Entering edit mode

Hi,
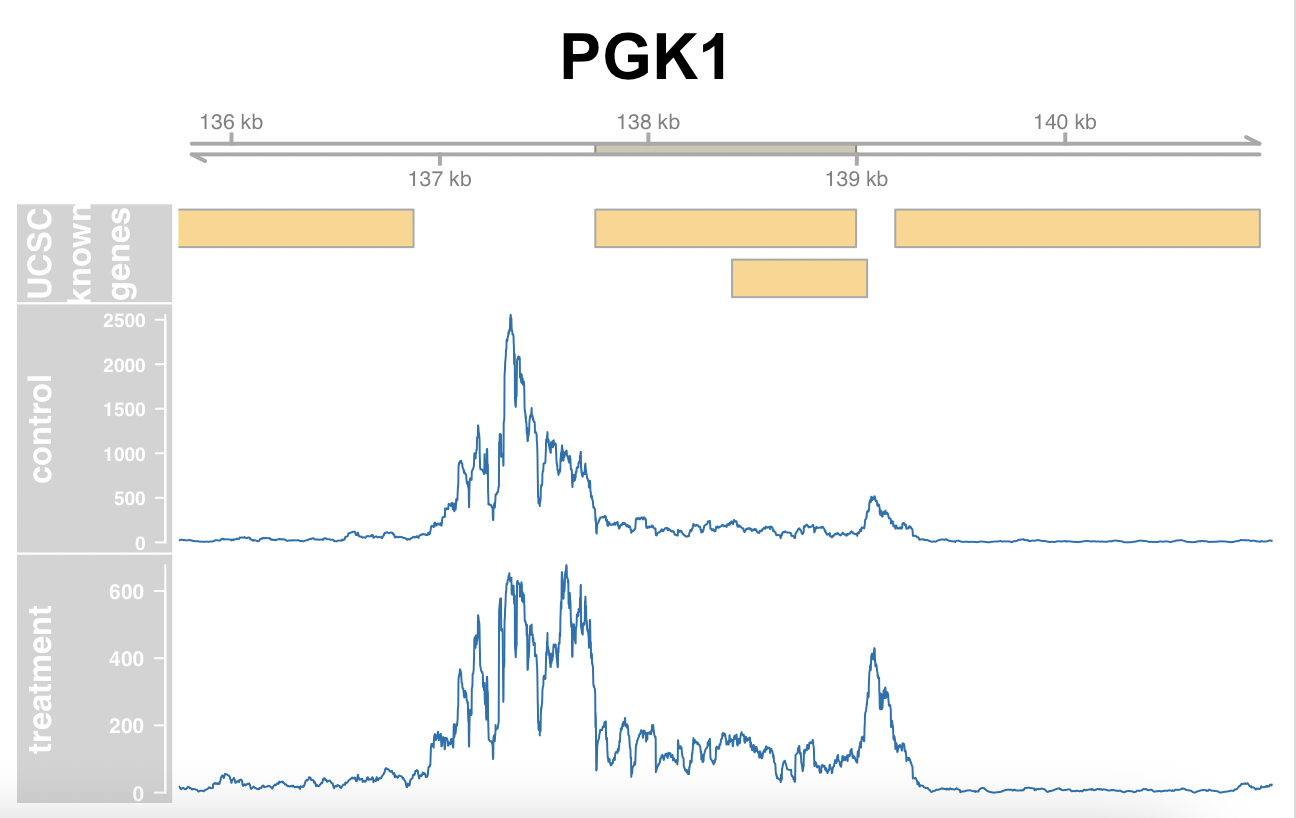
I am trying to plot some data in R using the Gviz package, but I can't seem to get the gene names to appear on the track nor can I get the ideogram function to work.
For the ideogram, I am aware that the yeast genome does not have cytobands, but I would like to plot the chromosome diagram and red bar mark indicating the region in my plots.
The error I receive when I try running IdeogramTrack is:
itrack <- IdeogramTrack(genome = gen, chromosome = chr)
Error in .local(.Object, ...) : Failed to obtain 'hguid' cookie
For gene names, I would like to have them on top of the yellow bars indicating UCSC gene locations, but I'm not sure how to do so.
You'll need to show more code, for example how you created that
GeneRegionTrack, and what 'gen' and 'chr' are.Ideally it would also be a self-contained example that others could run, rather than using data that noboby has access to.
I think the above mentioned error is linked to old url scheme in rtracklayer (only http) which prevents fetching the data from UCSC servers. For reference: https://github.com/lawremi/rtracklayer/issues/91