Mixed up sample info with plotPCA
1
0
Entering edit mode
@e9a0a47b
Last seen 4 months ago
Sweden

Hi,

I am trying to do exploratory analysis of AmpliSeq data using a heatmap and a PCA plot (with DESeq2 and ggplot2). To do this I have been following the DESeq2 vignette. I manage to get both plots, but the sample information data (passage and day in my case) seems to be mixed up and I have not been able to find a reason for this.

In my data I have a time series with five different days (0, 5, 10, 15, 30), for five different passages of cells (A, B, C, D, E). However, passage D is missing Day 0, and passages D and E are missing day 30.

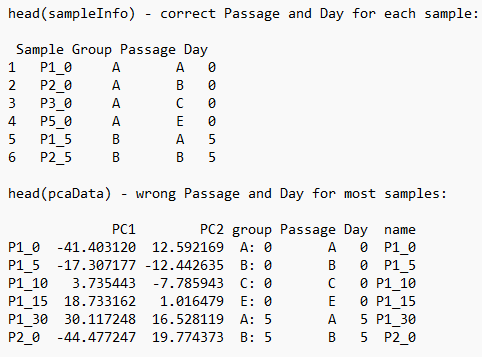
The sampleInfo for the DESeq looks correct (using head(sampleInfo)), but in the pcaData the sample information is mixed up, that is days and passages have been shifted. When looking at the heatmap, it seems possible that the same mix up has happened to the data.

Please note that I am new to R and appreciate any help I can get.

Heads for sampleInfo and pcaData

countdata<-read.csv("All.csv", header=TRUE, row.names=1)
sampleInfo<-read.csv("SI_All.csv", header=TRUE)
matMatrix<-as.matrix(countdata)
rownames <- countdata[,1]


dds <- DESeqDataSetFromMatrix(countData =matMatrix,colData = sampleInfo, design= ~ Group)

dds_norm <- estimateSizeFactors(dds)
normalized_counts <- counts(dds_norm, normalized=TRUE)
write.csv(normalized_counts, file="All_norm_counts.csv")

dds <- DESeq(dds)
res <- results(dds)

DESeq2::plotMA(res,ylim=c(-8,8))

sampleDists <- dist(t(assay(dds)))
library("RColorBrewer")
sampleDistMatrix <- as.matrix(sampleDists)
rownames(sampleDistMatrix) <- paste(dds$Sample, dds$Group, sep="-")
colnames(sampleDistMatrix) <- NULL
colors <- colorRampPalette( rev(brewer.pal(9, "Blues")) )(255)
pheatmap(sampleDistMatrix,
    clustering_distance_rows=sampleDists,
    clustering_distance_cols=sampleDists,
    col=colors)

rdds <- rlog(dds)
pcaData <- DESeq2::plotPCA(rdds, intgroup=c("Passage","Day"), returnData=TRUE)
percentVar <- round(100 * attr(pcaData, "percentVar"))
ggplot(pcaData, aes(PC1, PC2,color=factor(rdds$Passage),shape=factor(rdds$Day))) +
    geom_point(size=3) +
    xlab(paste0("PC1: ",percentVar[1],"% variance")) +
    ylab(paste0("PC2: ",percentVar[2],"% variance")) + 
    coord_fixed()

Session Info:

R version 4.3.1 (2023-06-16 ucrt) Platform: x86_64-w64-mingw32/x64 (64-bit) Running under: Windows 11 x64 (build 22621)

Matrix products: default

locale: 1 LC_COLLATE=English_Sweden.utf8 LC_CTYPE=English_Sweden.utf8 LC_MONETARY=English_Sweden.utf8 [4] LC_NUMERIC=C LC_TIME=English_Sweden.utf8

time zone: Europe/Stockholm tzcode source: internal

attached base packages: 1 stats4 stats graphics grDevices utils datasets methods base

other attached packages: 1 edgeR_3.42.4 limma_3.56.2 DESeq2_1.40.2
[4] SummarizedExperiment_1.30.2 Biobase_2.60.0 MatrixGenerics_1.12.2
[7] matrixStats_1.0.0 GenomicRanges_1.52.0 GenomeInfoDb_1.36.1
[10] IRanges_2.34.1 S4Vectors_0.38.1 BiocGenerics_0.46.0
[13] glmpca_0.2.0 PoiClaClu_1.0.2.1 RColorBrewer_1.1-3
[16] pheatmap_1.0.12 dplyr_1.1.2 ggplot2_3.4.3

loaded via a namespace (and not attached): 1 utf8_1.2.3 generics_0.1.3 bitops_1.0-7 lattice_0.21-8
[5] magrittr_2.0.3 grid_4.3.1 Matrix_1.5-4.1 fansi_1.0.4
[9] scales_1.2.1 codetools_0.2-19 cli_3.6.1 rlang_1.1.1
[13] crayon_1.5.2 XVector_0.40.0 munsell_0.5.0 withr_2.5.1
[17] DelayedArray_0.26.6 S4Arrays_1.0.4 tools_4.3.1 parallel_4.3.1
[21] BiocParallel_1.34.2 colorspace_2.1-0 locfit_1.5-9.8 GenomeInfoDbData_1.2.10 [25] vctrs_0.6.3 R6_2.5.1 lifecycle_1.0.3 zlibbioc_1.46.0
[29] MASS_7.3-60 pkgconfig_2.0.3 pillar_1.9.0 gtable_0.3.4
[33] glue_1.6.2 Rcpp_1.0.11 tibble_3.2.1 tidyselect_1.2.0
[37] rstudioapi_0.15.0 farver_2.1.1 labeling_0.4.3 compiler_4.3.1
[41] RCurl_1.98-1.12

```

plotMA ggplot2 plotPCA DESeq2 • 614 views
ADD COMMENT
0
Entering edit mode
@mikelove
Last seen 16 hours ago
United States

I can already tell there is code you aren't showing. For example, your pcaData has a variable 'group' that isn't in the previous sample information. Please post the exact code you used and its output rather than a screenshot of output.

E.g.:

> 1+2+3 # this code produces this output:
[1] 6
ADD COMMENT
0
Entering edit mode

Ok, thank you. This is everything from my session:

> library("ggplot2")
> library("dplyr")

Attaching package: 'dplyr'

The following objects are masked from 'package:stats':

    filter, lag

The following objects are masked from 'package:base':

    intersect, setdiff, setequal, union

> library("pheatmap")
> library("RColorBrewer")
> library("PoiClaClu")
> library("glmpca")
> library("DESeq2")
Loading required package: S4Vectors
Loading required package: stats4
Loading required package: BiocGenerics

Attaching package: 'BiocGenerics'

The following objects are masked from 'package:dplyr':

    combine, intersect, setdiff, union

The following objects are masked from 'package:stats':

    IQR, mad, sd, var, xtabs

The following objects are masked from 'package:base':

    anyDuplicated, aperm, append, as.data.frame, basename, cbind, colnames, dirname,
    do.call, duplicated, eval, evalq, Filter, Find, get, grep, grepl, intersect,
    is.unsorted, lapply, Map, mapply, match, mget, order, paste, pmax, pmax.int, pmin,
    pmin.int, Position, rank, rbind, Reduce, rownames, sapply, setdiff, sort, table,
    tapply, union, unique, unsplit, which.max, which.min


Attaching package: 'S4Vectors'

The following objects are masked from 'package:dplyr':

    first, rename

The following object is masked from 'package:utils':

    findMatches

The following objects are masked from 'package:base':

    expand.grid, I, unname

Loading required package: IRanges

Attaching package: 'IRanges'

The following objects are masked from 'package:dplyr':

    collapse, desc, slice

The following object is masked from 'package:grDevices':

    windows

Loading required package: GenomicRanges
Loading required package: GenomeInfoDb
Loading required package: SummarizedExperiment
Loading required package: MatrixGenerics
Loading required package: matrixStats

Attaching package: 'matrixStats'

The following object is masked from 'package:dplyr':

    count


Attaching package: 'MatrixGenerics'

The following objects are masked from 'package:matrixStats':

    colAlls, colAnyNAs, colAnys, colAvgsPerRowSet, colCollapse, colCounts, colCummaxs,
    colCummins, colCumprods, colCumsums, colDiffs, colIQRDiffs, colIQRs, colLogSumExps,
    colMadDiffs, colMads, colMaxs, colMeans2, colMedians, colMins, colOrderStats, colProds,
    colQuantiles, colRanges, colRanks, colSdDiffs, colSds, colSums2, colTabulates,
    colVarDiffs, colVars, colWeightedMads, colWeightedMeans, colWeightedMedians,
    colWeightedSds, colWeightedVars, rowAlls, rowAnyNAs, rowAnys, rowAvgsPerColSet,
    rowCollapse, rowCounts, rowCummaxs, rowCummins, rowCumprods, rowCumsums, rowDiffs,
    rowIQRDiffs, rowIQRs, rowLogSumExps, rowMadDiffs, rowMads, rowMaxs, rowMeans2,
    rowMedians, rowMins, rowOrderStats, rowProds, rowQuantiles, rowRanges, rowRanks,
    rowSdDiffs, rowSds, rowSums2, rowTabulates, rowVarDiffs, rowVars, rowWeightedMads,
    rowWeightedMeans, rowWeightedMedians, rowWeightedSds, rowWeightedVars

Loading required package: Biobase
Welcome to Bioconductor

    Vignettes contain introductory material; view with 'browseVignettes()'. To cite
    Bioconductor, see 'citation("Biobase")', and for packages 'citation("pkgname")'.


Attaching package: 'Biobase'

The following object is masked from 'package:MatrixGenerics':

    rowMedians

The following objects are masked from 'package:matrixStats':

    anyMissing, rowMedians

> library(edgeR)
Loading required package: limma

Attaching package: 'limma'

The following object is masked from 'package:DESeq2':

    plotMA

The following object is masked from 'package:BiocGenerics':

    plotMA

> 
> 
> ## Create a matrix
> 
> countdata<-read.csv("All.csv", header=TRUE, row.names=1)
> sampleInfo<-read.csv("SI_All.csv", header=TRUE)
> matMatrix<-as.matrix(countdata)
> rownames <- countdata[,1]
> 
> ## Create A DESeq2 dataset
> 
> dds <- DESeqDataSetFromMatrix(countData =matMatrix,colData = sampleInfo, design= ~ Group)
Warning message:
In DESeqDataSet(se, design = design, ignoreRank) :
  some variables in design formula are characters, converting to factors
> 
> ## Get normalized values
> 
> dds_norm <- estimateSizeFactors(dds)
> normalized_counts <- counts(dds_norm, normalized=TRUE)
> write.csv(normalized_counts, file="All_norm_counts.csv")
> 
> ## Run DE analysis
> 
> dds <- DESeq(dds)
estimating size factors
estimating dispersions
gene-wise dispersion estimates
mean-dispersion relationship
final dispersion estimates
fitting model and testing
> res <- results(dds)
> 
> ## Visualization of the data
> 
> DESeq2::plotMA(res,ylim=c(-8,8))
> 
> sampleDists <- dist(t(assay(dds)))
> library("RColorBrewer")
> sampleDistMatrix <- as.matrix(sampleDists)
> rownames(sampleDistMatrix) <- paste(dds$Sample, dds$Group, sep="-")
> colnames(sampleDistMatrix) <- NULL
> colors <- colorRampPalette( rev(brewer.pal(9, "Blues")) )(255)
> pheatmap(sampleDistMatrix,
+          clustering_distance_rows=sampleDists,
+          clustering_distance_cols=sampleDists,
+          col=colors)
> 
> rdds <- rlog(dds)
> pcaData <- DESeq2::plotPCA(rdds, intgroup=c("Passage","Day"), returnData=TRUE)
> percentVar <- round(100 * attr(pcaData, "percentVar"))
> ggplot(pcaData, aes(PC1, PC2,color=factor(rdds$Passage),shape=factor(rdds$Day))) +
+     geom_point(size=3) +
+     xlab(paste0("PC1: ",percentVar[1],"% variance")) +
+     ylab(paste0("PC2: ",percentVar[2],"% variance")) + 
+     coord_fixed()
> head(rdds)
class: DESeqTransform 
dim: 6 22 
metadata(1): version
assays(1): ''
rownames(6): SEC24B-AS1 A1BG ... A2M A2ML1
rowData names(35): baseMean baseVar ... dispFit rlogIntercept
colnames(22): P1_0 P1_5 ... P5_5 P5_10
colData names(5): Sample Group Passage Day sizeFactor
> head(res)
log2 fold change (MLE): Group E vs A 
Wald test p-value: Group E vs A 
DataFrame with 6 rows and 6 columns
            baseMean log2FoldChange     lfcSE      stat    pvalue      padj
           <numeric>      <numeric> <numeric> <numeric> <numeric> <numeric>
SEC24B-AS1   4.11519       1.498284  0.948900  1.578969  0.114343  0.343207
A1BG        11.27725      -0.241909  0.590541 -0.409640  0.682070  0.869248
A1CF         0.00000             NA        NA        NA        NA        NA
GGACT        1.68097      -0.491430  1.309797 -0.375196  0.707515  0.882295
A2M        115.00317       0.391490  1.302733  0.300514  0.763785  0.907665
A2ML1        0.00000             NA        NA        NA        NA        NA
> head(sampleInfo)
  Sample Group Passage Day
1   P1_0     A       A   0
2   P2_0     A       B   0
3   P3_0     A       C   0
4   P5_0     A       E   0
5   P1_5     B       A   5
6   P2_5     B       B   5
> head(pcaData)
             PC1        PC2 group Passage Day  name
P1_0  -41.403120  12.592169  A: 0       A   0  P1_0
P1_5  -17.307177 -12.442635  B: 0       B   0  P1_5
P1_10   3.735443  -7.785943  C: 0       C   0 P1_10
P1_15  18.733162   1.016479  E: 0       E   0 P1_15
P1_30  30.117248  16.528119  A: 5       A   5 P1_30
P2_0  -44.477247  19.774373  B: 5       B   5  P2_0
> vignette(DESeq2)
Error: object 'DESeq2' not found
> vignette("DESeq2")
> ?plotPCA
ADD REPLY
0
Entering edit mode

Check colnames of count data.

I think you are providing these in different order to DESeq2.

ADD REPLY
0
Entering edit mode

You were correct. The order of my samples in my sample info-file did not match the order of the samples in my count data file. Thank you!

ADD REPLY
1
Entering edit mode

Just as a note, if the sample info table had been named (that is rownames(sampleInfo) not NULL, DESeq2 would have been able to detect the mis-ordering and notify you.

ADD REPLY

Login before adding your answer.

Traffic: 669 users visited in the last hour
Help About
FAQ
Access RSS
API
Stats

Use of this site constitutes acceptance of our User Agreement and Privacy Policy.

Powered by the version 2.3.6