
Dear Bioconductor community,
I'm currently in the process of normalizing my data for methylation analysis, and I've employed two different methods: preprocessFunnorm and preprocessQuantile.
The primary distinction lies in the normalization approach, while other quality control steps and parameters remain consistent.
I'm working with samples from bipolar disorder patients, specifically VPA non-responders and good responders with repeated measures (at baseline(T0) and at follow-up(T1))
Sample_Name Sample_Date Response
MET_01        T0      Non_responder

MET_02        T0      Responder

MET_03
.
.
.

MET_01        T1      Non_responder

MET_02        T1      Responder
#### Quantile ####

mSetquantile_VPA <- preprocessQuantile(rgSet_VPA)

#After QC I finally get mSetquantile_VPAFlt (Quantile)

mValsq_VPA <- getM(mSetquantile_VPAFlt)


#### Funnorm ####

mSetFunnorm_VPA <- preprocessFunnorm(rgSet_VPA)

#After QC I finally get mSetFunnorm_VPAFlt (Funnorm)

mValsq_VPA_fun <- getM(mSetFunnorm_VPAFlt)
Note that this algorithm relies on the assumptions necessary for quantile normalization to be applicable and thus is not recommended for cases where global changes are expected such as in cancer-normal comparisons as these would be removed by the normalization.
In my study, I anticipated global changes as I compared VPA non-responders and VPA responders, leading me to believe that utilizing mVals_VPA_fun for downstream analysis was appropriate. However, upon creating a density plot, I observed unexpected patterns.
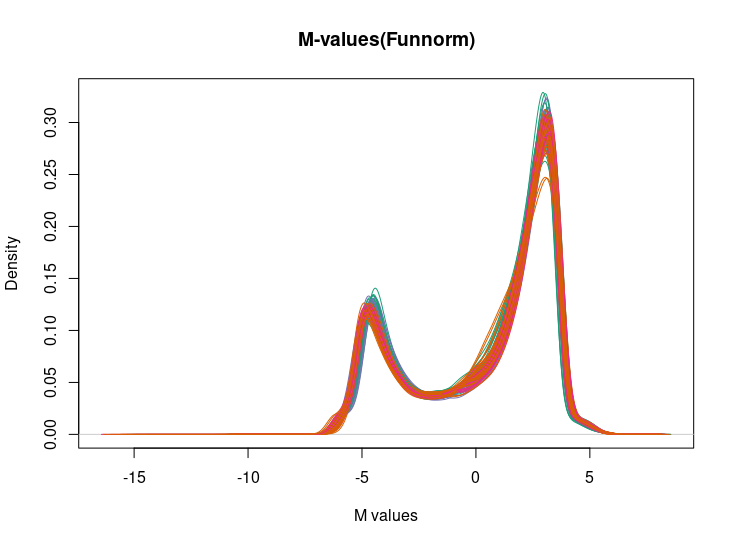
The negative values present in the plot, potentially stemming from -Inf values, suggest CpG sites consistently found unmethylated in the sample DNA.
Considering this, is it advisable to exclude CpG sites with -Inf values?
I am uncertain about proceeding with downstream analysis using mVals_VPA_fun.
Additionally, when I generated a density plot for mValsq_VPA (Quantile method), it exhibited differences compared to the Funnorm approach.
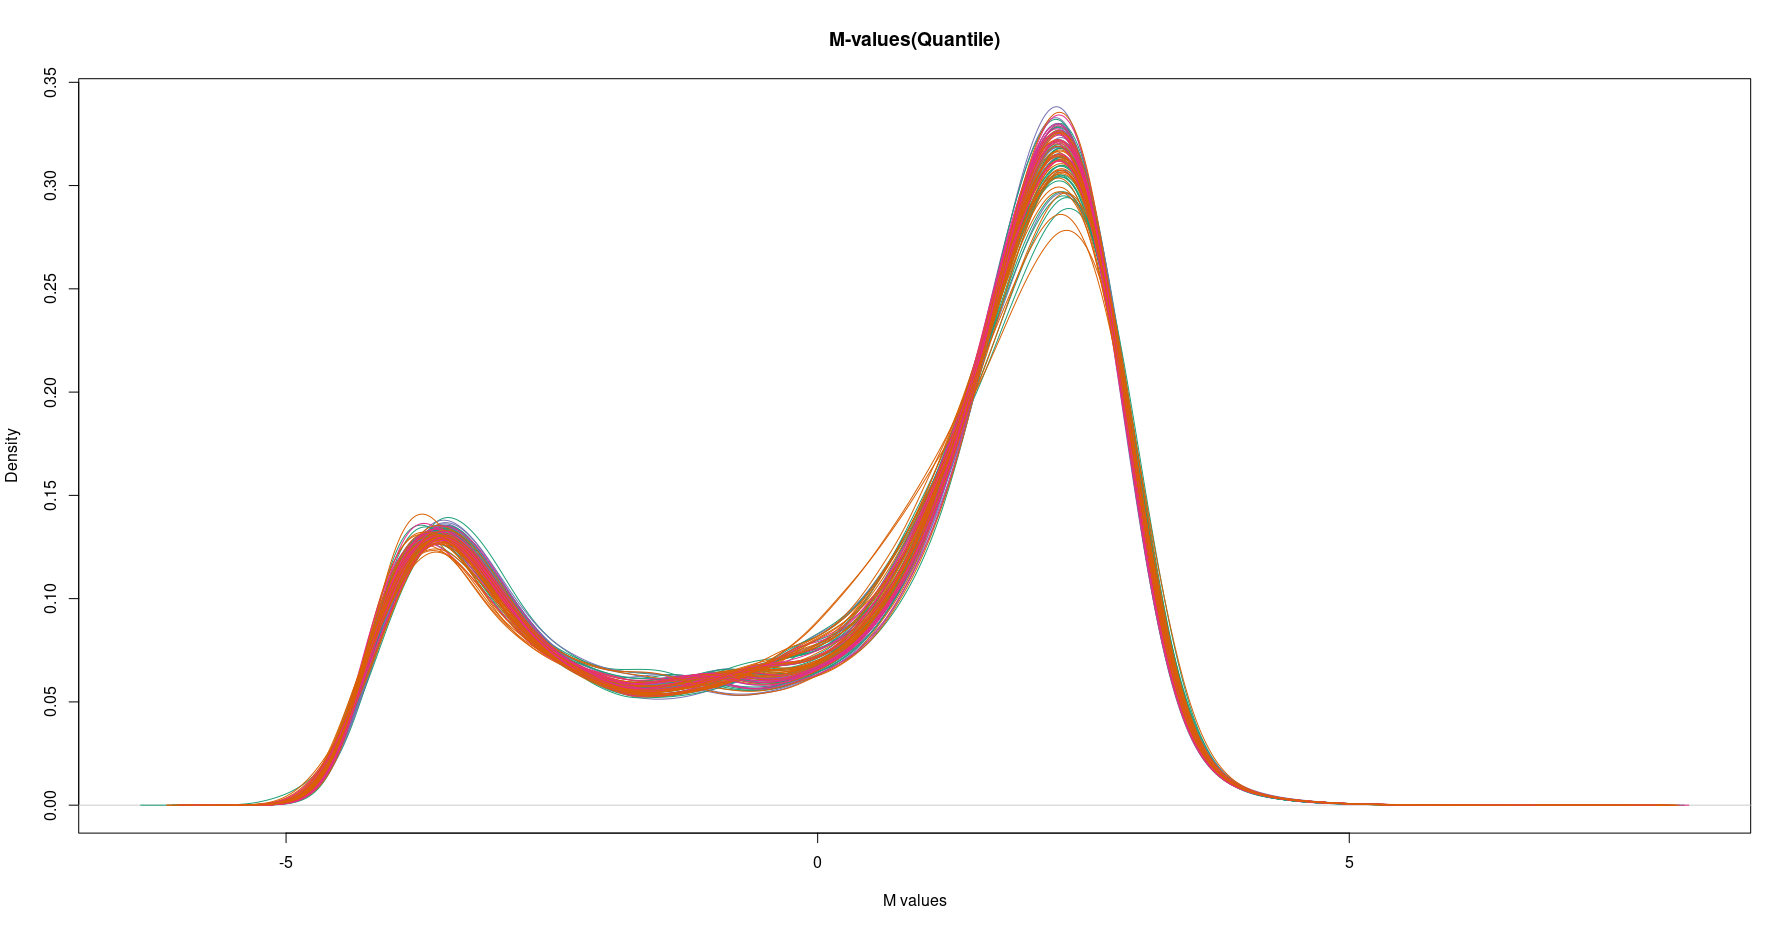
Based on these density plots, it seems that preprocessQuantile might be more suitable than preprocessFunnorm. Would this interpretation be accurate?
One more question,
I adjust the age with constructing model matrix. I considered both baseline age and follow-up age.
Do I need to consider only baseline age?
Sorry for basic question. I want to clarify it it is right way to analyze the methylation data.
I appreciate your assistance in clarifying these aspects. Thank you in advance.
Best,
Yujin