Entering edit mode

Hello! I have a general inquiry about the conceptual process and analysis within DESEQ packages. I am running some bulk RNA data through DESEQ2. Some ideas around the code and files are confusing my troubleshooting. Below are my questions:
- How does creating a
deseqobject usingdds <- DESeqDataSetFromMatrix(countData = countdata, colData = colData, design = ~ condition + batch, tidy = TRUE)differ from an object afterdds<-deseq(dds)? How is the count matrix being changed by thedeseq()code? - Specifying my batch as a covariate in
~ condition + batchdid not seem to correct my batch effect, so I used Limma for batch correction. Is it appropriate to use Limma batch corrected output to perform further downstream analysis and plotting (result(), PCA, MA plots, heatmaps, etc.)? - Are there any tips/advice regarding effective plotting, statistical analysis, alpha values, etc.?
I would truly appreciate any insight I can receive. It is pretty amazing to start learning bioinformatics, and I hope to continue more after this project. Thank you!

Thank you for your reply! I have performed
deseq()with the multi-factor design of~batch + condition. However, when I plot it in PCA with the interest group ofvsd <- vst(dds,blind= FALSE) plotPCA(vsd,intgroup=c("condition"))I am still observing a batch effect within my samples. Should I be performing batch correction using packages such as SUV?You've read the FAQ that I linked to in my reply to your other post? The FAQ directly answers this.
Thank you for your reply on this and my other post. I did follow your instructions for multi-factor design using the RUV package. However, even if I include the other factors I still encounter same issue where my PCA plot shows clustering based on the batches instead of condition.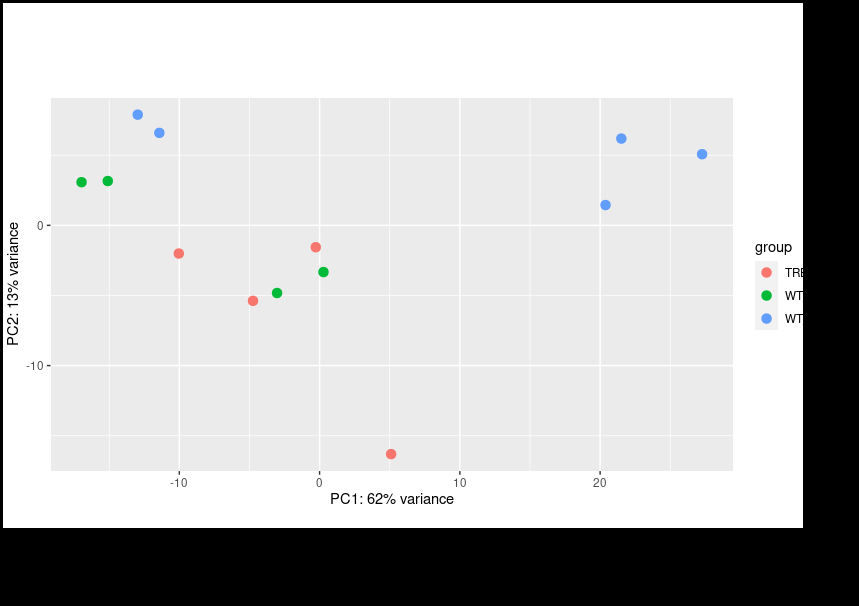
Only after Limma
removeBatchEffectfunction will it cluster by condition; however, I am informed that Limma corrected values should not be used for downstream analysis. Should I look for alternative methods?Hmm, I think we are just having trouble communicating, we are kind of talking past each other here.
The FAQ says that what you describe is exactly what is expected.
Limma removeBatchEffect does something to the data you use for the PCA plot which you can think of as analogous to what happens when you use a multi-factor design with DESeq2 but with the original counts. You don't need to modify the original counts for differential analysis.
So you don't need to have concern here.