Entering edit mode

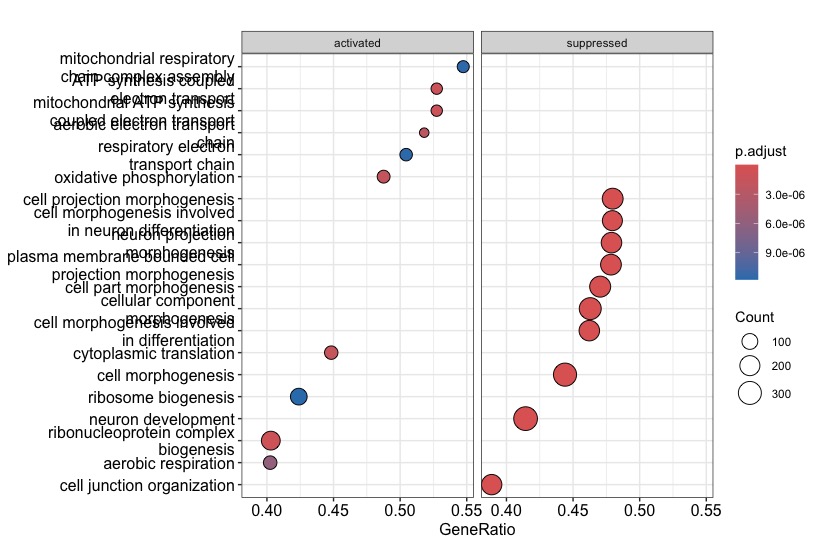
Hi everyone, I am a novice in the enrichment analyses and I have a problem with the gseGO function of the clusterprofiler package in R. Basically I'm analyzing mouse expression data and when I go to run the analysis with my code there seem to be only enriched pathways (with positive NES). I don't understand why if I use the human annotation org.Hs.eg.db my results and graphs come out as I expect them to. The first plot comes from the following code with mouse annotation (org.Mm.eg.db) and the second plot comes from the code with the human annotation.
GO_gsea <- function(df) {
                     library(clusterProfiler)
                     library(org.Mm.eg.db)
                     geneList = df[,2]
                     names(geneList) = as.character(df[,7])
                     geneList = sort(geneList, decreasing = TRUE)
                     data_GO_GSEA <- gseGO(geneList = geneList, OrgDb = org.Mm.eg.db, ont = "BP",
                                                     minGSSize = 3, maxGSSize = 800, pvalueCutoff = 0.05, verbose = TRUE,
                                                     keyType = "SYMBOL", pAdjustMethod = "BH", eps = 0) }
CeO2vsDiff1_gsea <- GO_gsea(CeO2vsDiff1)
dotplot(CeO2vsDiff1_gsea, showCategory=10, split=".sign") + facet_grid(.~.sign)

sessionInfo( )
R version 4.3.1 (2023-06-16)
Platform: aarch64-apple-darwin20 (64-bit)
Running under: macOS Sonoma 14.4

Matrix products: default
BLAS:   /System/Library/Frameworks/Accelerate.framework/Versions/A/Frameworks/vecLib.framework/Versions/A/libBLAS.dylib
LAPACK: /Library/Frameworks/R.framework/Versions/4.3-arm64/Resources/lib/libRlapack.dylib;  LAPACK version 3.11.0

locale:
[1] en_US.UTF-8/en_US.UTF-8/en_US.UTF-8/C/en_US.UTF-8/en_US.UTF-8

time zone: Europe/Rome
tzcode source: internal

attached base packages:
[1] stats4    stats     graphics  grDevices utils     datasets  methods   base

other attached packages:
 [1] BiocManager_1.30.22   org.Hs.eg.db_3.17.0   lubridate_1.9.3       forcats_1.0.0
 [5] stringr_1.5.1         dplyr_1.1.4           purrr_1.0.2           readr_2.1.5
 [9] tidyr_1.3.1           tibble_3.2.1          tidyverse_2.0.0       org.Mm.eg.db_3.17.0
[13] AnnotationDbi_1.62.2  IRanges_2.34.1        S4Vectors_0.38.2      Biobase_2.60.0
[17] BiocGenerics_0.46.0   ggplot2_3.5.0         enrichplot_1.20.3     clusterProfiler_4.8.3

loaded via a namespace (and not attached):
 [1] DBI_1.2.2               bitops_1.0-7            gson_0.1.0
 [4] shadowtext_0.1.3        gridExtra_2.3           rlang_1.1.3
 [7] magrittr_2.0.3          DOSE_3.26.2             compiler_4.3.1
[10] RSQLite_2.3.5           png_0.1-8               vctrs_0.6.5
[13] reshape2_1.4.4          pkgconfig_2.0.3         crayon_1.5.2
[16] fastmap_1.1.1           XVector_0.40.0          labeling_0.4.3
[19] ggraph_2.2.1            utf8_1.2.4              HDO.db_0.99.1
[22] tzdb_0.4.0              bit_4.0.5               zlibbioc_1.46.0
[25] cachem_1.0.8            aplot_0.2.2             jsonlite_1.8.8
[28] GenomeInfoDb_1.36.4     blob_1.2.4              BiocParallel_1.34.2
[31] tweenr_2.0.3            parallel_4.3.1          R6_2.5.1
[34] stringi_1.8.3           RColorBrewer_1.1-3      GOSemSim_2.26.1
[37] Rcpp_1.0.12             downloader_0.4          timechange_0.3.0
[40] Matrix_1.6-5            splines_4.3.1           igraph_2.0.3
[43] tidyselect_1.2.1        qvalue_2.32.0           rstudioapi_0.15.0
[46] viridis_0.6.5           codetools_0.2-19        lattice_0.22-6
[49] plyr_1.8.9              treeio_1.24.3           withr_3.0.0
[52] KEGGREST_1.40.1         gridGraphics_0.5-1      scatterpie_0.2.1
[55] polyclip_1.10-6         Biostrings_2.68.1       pillar_1.9.0
[58] ggtree_3.8.2            ggfun_0.1.4             generics_0.1.3
[61] RCurl_1.98-1.14         hms_1.1.3               munsell_0.5.0
[64] scales_1.3.0            tidytree_0.4.6          glue_1.7.0
[67] lazyeval_0.2.2          tools_4.3.1             data.table_1.15.2
[70] fgsea_1.26.0            fs_1.6.3                graphlayouts_1.1.1
[73] fastmatch_1.1-4         tidygraph_1.3.1         cowplot_1.1.3
[76] grid_4.3.1              ape_5.7-1               colorspace_2.1-0
[79] nlme_3.1-164            GenomeInfoDbData_1.2.10 patchwork_1.2.0
[82] ggforce_0.4.2           cli_3.6.2               fansi_1.0.6
[85] viridisLite_0.4.2       gtable_0.3.4            yulab.utils_0.1.4
[88] digest_0.6.35           ggrepel_0.9.5           ggplotify_0.1.2
[91] farver_2.1.1            memoise_2.0.1           lifecycle_1.0.4
[94] httr_1.4.7              GO.db_3.17.0            bit64_4.0.5
[97] MASS_7.3-60.0.1
Error in exists(cacheKey, where = .rs.WorkingDataEnv, inherits = FALSE) :
  invalid first argument
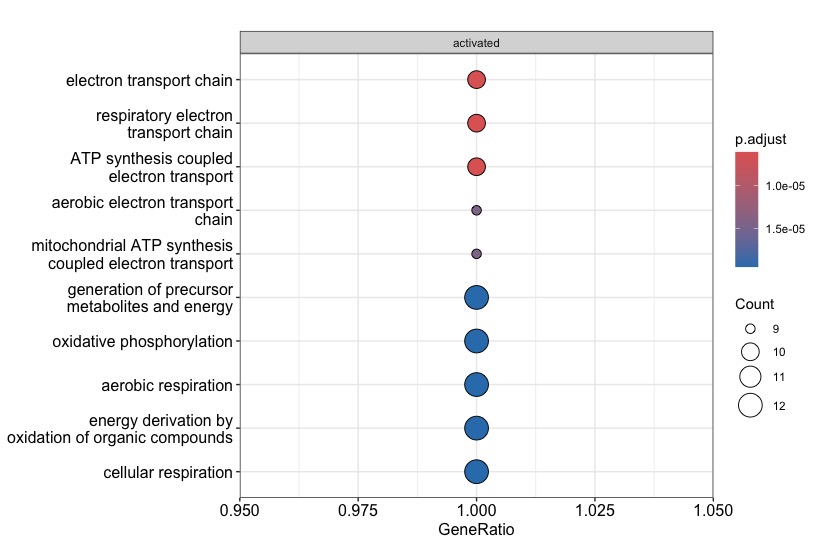
Note the very low number of genes in the gene sets of the mouse analysis (see the
Countcircles)!Based on this it seems that only very few gene symbols could be mapped to GO categories. In other words, it could be that most of your mouse input is being ignored. So double check that your mouse input are really
SYMBOLS, and not for exampleALIAS. Thus check manually that all of your input maps toENTREZID(because this is the central identifier type used inorg.Mm.eg.db, which in turn is used under the hood by thegseGO).