Entering edit mode

Hi all,
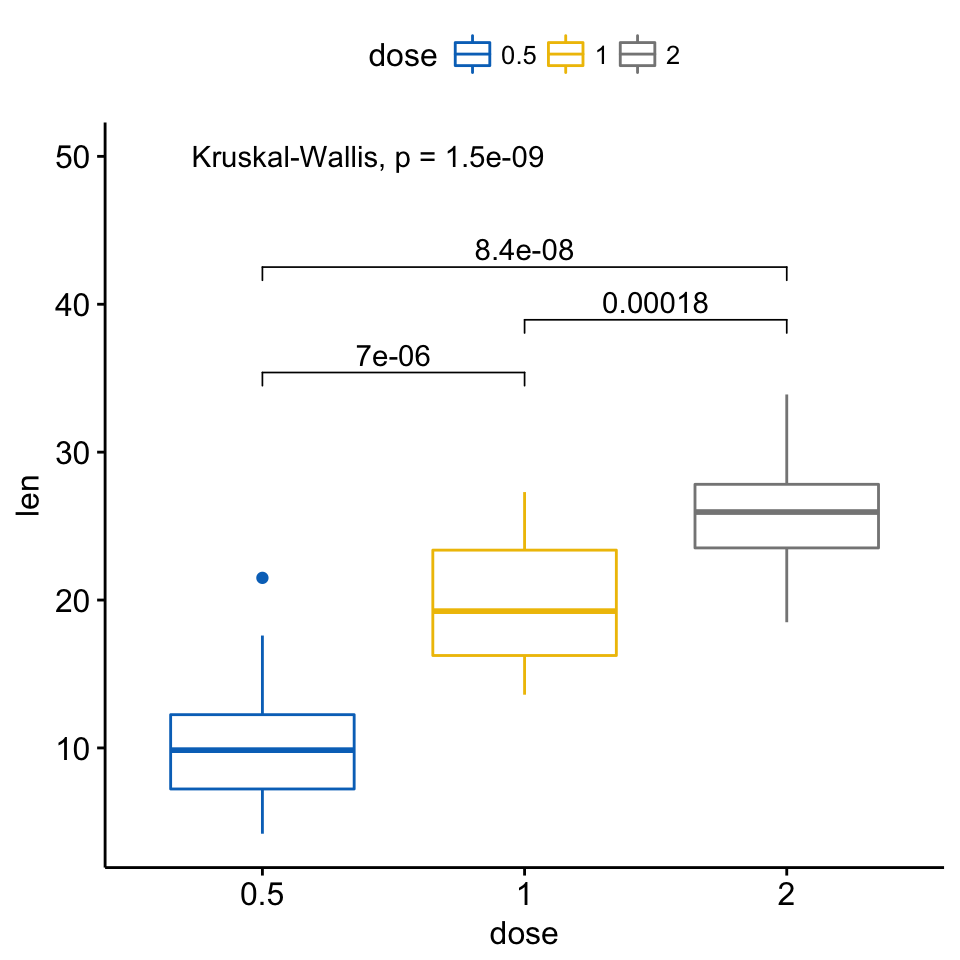
I use limma to compare pathway score between 3 groups. Then I would like to make boxplot with overall p value and pairwise p value. I use this with method ='t.test' or method='anova':
ggboxplot(data, x = "disease_state", y = "pathway_name",
          color = "dem8", palette = "jco") +
  stat_compare_means(comparisons = my_comparisons, method = 't.test') + # Add pairwise comparisons p-value
  stat_compare_means(label.y = 0.6, method = 't.test') +
  labs(y = "Pathway Score", title = "pathway_name")
The value from t test or anova is different from the p value from limma:
topTable <- topTable(fit2, number=Inf, sort.by="none")
topTableLSvsNC <- topTable(fit2, coef="LSvsNC", number=Inf, sort.by="none")
Would you please have an explanation for the difference and how to make boxplot with overall p value and pairwise p value from limma? Is that because statistical model difference which limma is better? I use a manual way: extract p value from topTable and then use geom_text to annotate to boxplot. But for pairwise p value I don't know how. Thank you so much!
Regarding the difference between the p-value from a t-test and a p-value from limma, this has been previously discussed in this forum, at least in this post.
Thanks Robert. I think p value from limma is better, now just try to add them to boxplot.
Read LIMMA: where to find the ANOVA?
topTable(fit2) table reports the ANOVA p-value.
topTableLSvsNC reports the p-value for the specified contrast. Loop over the contrasts to get the "pairwise" p-values. These p-values are adjusted per contrast.
Yes, I know how to extract these p value but how to add them to the boxplot in a nice way like the example plot above?
ggpubr is based on ggsignif. Read the documentation of geom_signif.
All you need is the list of comparisons and the corresponding text to place on top of the horizontal bar.
Here is a simple example using that helps you building this.
Thank you so much! I try now, hope it works. It worked. I try to figure out how to make a boxplot and then try to combine 11 boxplots into one figure. For only one overall p value, this worked:
I used
pivot_longer()to make long_data. This way, I don't have to manually annotate each plot. Do you have any suggestion for pairwise p value for multiple boxplot?