
Hi everyone,
I am investigating a CRISPR KO screen by modelling it as RNA-Seq data (I am aware that specialised tools for this exist e.g. MAGeCK, but am new to coding/R and am most familiar with DESeq2 for now), and it got me thinking about the ways in which we conduct differential analysis, and the differences between them.
I first modelled the count data as usual using DESeq2, after exporting in the data and study design (3 timepoints, gene of interest expression either high or low, 5 sgRNAs per gene, individually assessed). Here I show an example, using the comparison of WT Myc after 0 or 10 days.
#Prep dds object
dds <- DESeqDataSetFromMatrix(countData = countdata, colData = coldata, design = ~Gene + Time)
dds$group <- factor(paste0(dds$Gene, dds$Time))
design(dds) <- ~group

#Run differential analysis
dds <- DESeq(dds)
resultsNames(dds)
A_WT10vsWT0 <- lfcShrink(dds, contrast=c("group", "WTT10", "WTT0"), type="ashr")

#Make volcano plot plotting FC vs padj
EnhancedVolcano(df_A,
  lab = NA,
  x = 'log2FoldChange',
  y = 'padj',
  title = "WT_T10 vs WT_T0",
  pCutoff = 0.05)
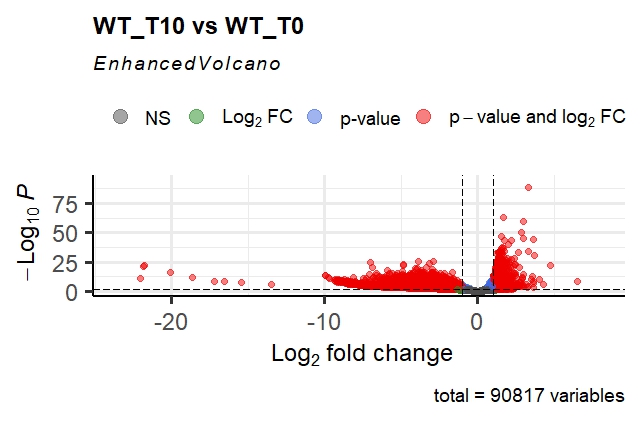
This gives me the following volcano plot; as you can see, it is very asymmetrical, and the p-adj values are extremely small for some genes. The fold changes are also extremely high in magnitude!
Out of interest, coming from the proteomics world, I imported the normalised counts into Perseus, log2 transformed these and ran the volcano plot function (t-test). This gave me the following result:
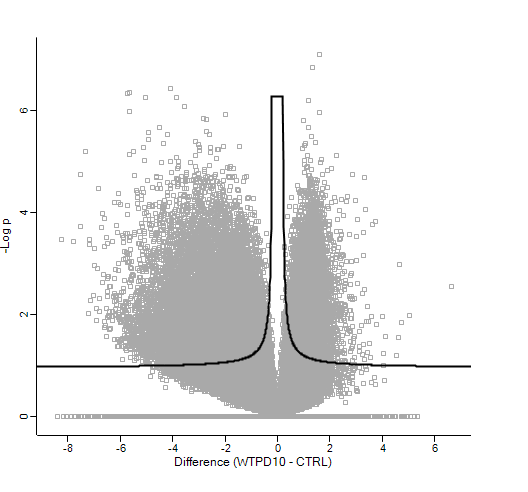
Which as you can see, is very different (at least in terms of p-value!)
I am trying to get to grips with why the differences in these two methods occur, and would like some opinions from the community. My current thoughts are:
- Proteomics data is usually log-norm, but RNA-Seq count data follows more the negative binomial. Therefore, the DESeq2 method of DE may be more appropriate. Indeed, the log2(count) distribution is not normal, and the DESeq2 vignette advises against DE using logged values (although I could not find an explicit reason why?):
- This still does not explain why the DESeq2 volcano is so far from a "regular" volcano plot. The p-values and fold changes both seem quite high, even after shrinkage for the latter. I'm not sure if the fact that this is a CRISPR KO screen has something to do with it. Both the distributions and the magnitudes seem strange; would people classify this as an issue? I have seen opinions that at such values, all that we need to intepret it as is "this effect is extremely far from the null hypothesis", but it still seems jarring that this can occur with a dataset of n=3 repeats per condition.
In summary, I am confused about:
- If log2-based DE and negative binomial GLM-based DE analysis are both valid methods for analysis of RNA-Seq count data
- What exactly is causing the drastic differences between the two, if they are both valid (apart from the fact they are two different statistical approaches?)
- If the seemingly extreme values of p-adj/FC are concerning.
Many thanks.
MAGeCK is a command line tool that is easy to use. I recommend you use it because a) the logFCs from DESeq2 and MAGeCK will be very similar (the DESeq2 author is on the MAGeCK paper and much of established RNA-seq analysis theory has channeled into the tool), and b) because the actual magic in MAGeCK (drum sound...) is the aggregation of the individual sgRNAs into a single per-gene statement. This is done by robust rank aggregation. Without such an aggregation method you have many (often conflicting) readouts per gene for the individual sgRNAs that are hard to interpret. What is also critical is normalization, I hope you have non-targeting controls to normalize to.
Yes. limma-trend uses logCPMs directly to perform DE analysis, while tools like edgeR and DESeq2 model raw counts in GLMs.
I would say that is normal in CRISPR/shRNA screens. That is why you must have many guides per gene and then an aggregation method (see my comment above) to make a per-gene statement. Can be an off-target effect or any other noise. These assays have considerable uncertainty.
Thanks for the explanations, it has helped clarify some things. Unfortunately, I am working from an early access public dataset (https://doi.org/10.1101/2024.04.25.590465) which only provides a count matrix for sgRNAs targeting genes and does not mention using non-targeting controls (the count table is apparently what they used for input into EdgeR/MAGeCK; I am just re-processing due to being uncertain about how they used the edgeR analysis to reach gene level. Therefore, regarding normalisation - I do not have non-targeting controls, as those counts are not provided. Is it still possible to let DESeq2 "normalise" within the GLM models? And if I were to have non-targeting controls, would I need to change the code to specify that those are the sgRNAs to normalise to?
Would you also have any thoughts about why the two methods to obtain volcano plots give so different results in this case?
edgeR devs published something for screens with edgeR: https://pubmed.ncbi.nlm.nih.gov/24860646/
The normalization in DESeq2 (and edgeR) by itself have nothing to do with GLMs. They derive size- and normalization factors, see for explanation about principle: These factors are then used in the GLM as offsets.
If you have no controls then just use DESeq2 normalization with default settings. This assumes that most guides have no effect and are a robust estimate of the "baseline". If this assumption holds I do not know for your data.
Differences in fold change and pvalue calculations -- I see no point investingating this further as it is known and established that t-tests are inferior to the other methods in the presence of small sample sizes. Use an established tool, as they exist for a reason.