hello everyone, i have download raw SRA data under project "Bioenergetic mechanisms of alcohol-associated cirrhosis in patient derived hepatocytes" and i align them using hisat2, followed by featurecounts for raw counts matrix. when i am trying to process the raw_counts using deseq2 the results are not satisfactory to me. please suggest me if it is something wrong with my data
this is the r-script which i am running
library(DESeq2)
library(tidyverse)
count_data <- read.csv('rawcount_data2.csv',row.names = 1)
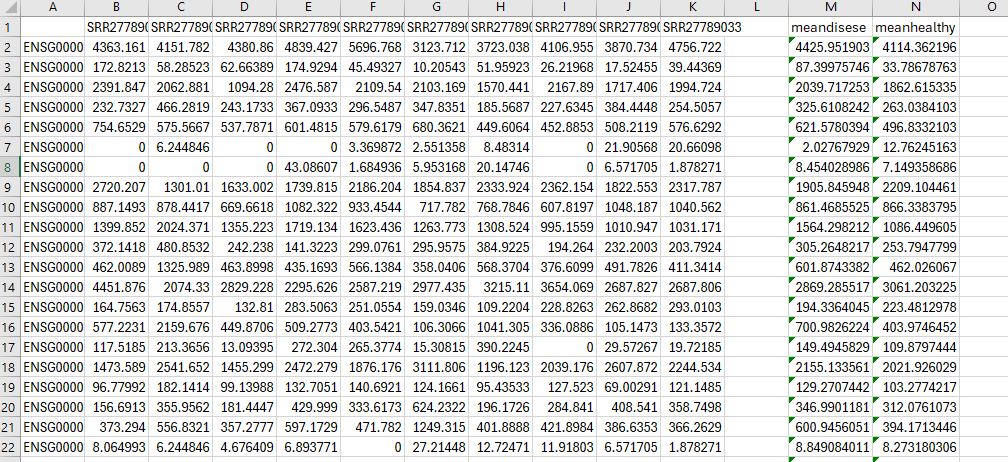
head(count_data)
colData <- read.csv('rawdatainfo.csv', row.names =1)
all(colnames(count_data) %in% rownames(colData))
all(colnames(count_data)== rownames(colData))
dds <- DESeqDataSetFromMatrix(countData = count_data,
colData = colData,
design = ~ condition)
dds
keep <- rowSums(counts(dds)) >=10
dds <- dds[keep,]
dds
dds$condition <- relevel(dds$condition, ref = "healthy")
dds <- DESeq(dds)
res <- results(dds)
res
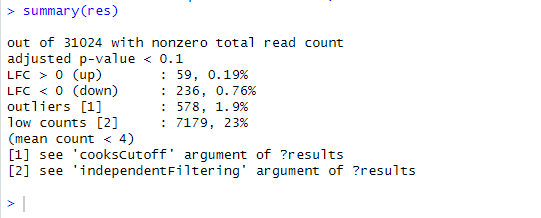
summary(res)
res0.05 <- results(dds, alpha = 0.05)
summary(res0.05)
the results of this script is as follow "Results summary
summary(res)
out of 31880 with nonzero total read count
adjusted p-value < 0.1
LFC > 0 (up) : 2, 0.0063%
LFC < 0 (down) : 3, 0.0094%
outliers 1 : 886, 2.8%
low counts 2 : 0, 0%
(mean count < 1)
1 see 'cooksCutoff' argument of ?results
2 see 'independentFiltering' argument of ?results
"
there are only 5 genes which are up and down regulated at adjusted p value <0.1.
please suggest me what to do now, it is urgent
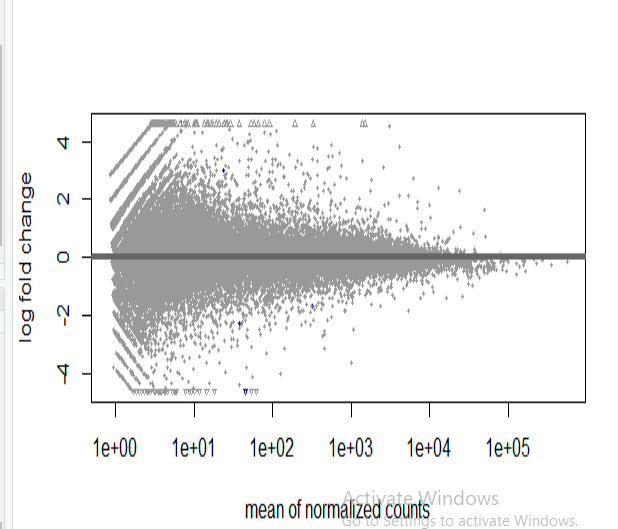
the MA plot for the above results is as follow
Cross-posted https://www.biostars.org/p/9594331/#9594458
Well, what is your question? The DESeq2 vignette covers how to do analysis, and some diagnostics, e.g. PCA to inspect data for batch effects and outliers. If you do all that, and this is the results, then it is what it is.
Not also that the screenshot of the counts is not raw counts. Featurecounts does not return fractional counts but integers.
could you please tell me if the results are fine or not?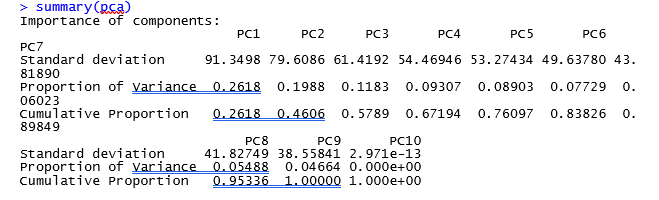
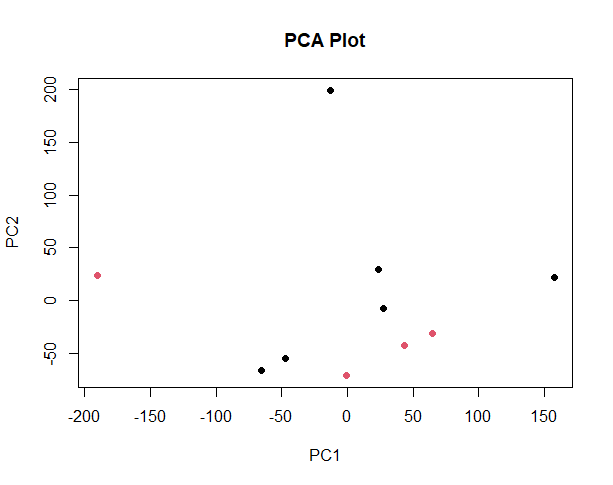
It looks like the PCA plot of a real RNASeq experiment. The red outlier on the left might be the mathematical reason why you have few valid DE genes.
thank you for your response, should i remove or discard that sample? since the red outlier on left represents one of healthy samples.
Ask the people who made the libraires if there was anything unusual in the QC of the outlier sample.
Try to figure out what biologically is behind PC1. Is it something simple like contamination, or read number?
Then run DESEq with and without the outlier, and report both results.
thank you so much and sorry for bothering you again and again, it is urgent because it is my project deadline. i have removed that sample and the results are quite improved compared to the previous one. But still some outlier genes are present. i have attached the results.