Entering edit mode

i have normalized the data using deseq2 internal normalization method. But it seems that my original input data is same as the normalized output. i don't know if the data has been normalized correctly or if there is any issue with my code. Because when i am going with the current normalized data it is giving me a very few up and down regulated genes on adjusted p value <0.1
Code should be placed in three backticks as shown below
library(DESeq2)
library(tidyverse)
count_data <- read.csv('rawcount_data2.csv',row.names = 1)
head(count_data)
colData <- read.csv('rawdatainfo.csv', row.names =1)
all(colnames(count_data) %in% rownames(colData))
all(colnames(count_data)== rownames(colData))
dds <- DESeqDataSetFromMatrix(countData = count_data,
colData = colData,
design = ~ condition)
levels(dds$condition)
dds
keep <- rowSums(counts(dds)) >=10
dds <- dds[keep,]
dds
#dds$condition <- relevel(dds$condition, ref = "healthy")
dds <- DESeq(dds)
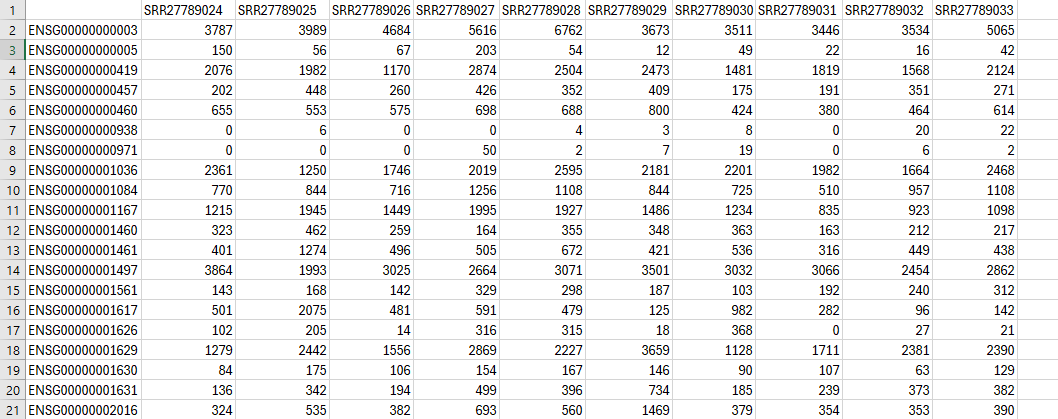
# Get the normalized counts
normalized_counts <- assay(dds)
# Write the normalized counts to a CSV file
write.csv(normalized_counts, file = "normalized_counts3.csv")
res <- results(dds)
res
summary(res)
sessionInfo( )
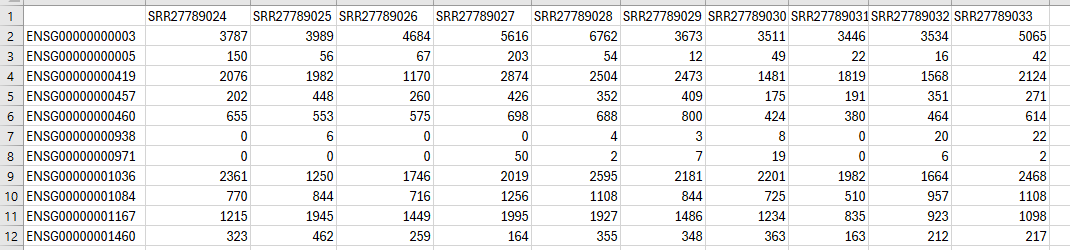
the original data before normalization