
Hi all,
This may seem long winded, but I am basically asking if I should expect to be able to plot the effect of adding RUV on the counts from:
raw <- counts(dds, normalized = FALSE)
deseq <- counts(dds, normalized = TRUE) # only this one is shown in the images below
vst <- assay(vst(dds, blind=FALSE))
rlog <- assay(rlog(dds, blind=FALSE))
it seems they don't "see" the covariate columns of colData(dds) - I feel like I've badly misunderstood something
I think I may be wrong in my expectation here. I thought that if I include RUV output in a new deseqdataset then the EDA plots (pca/rle/heatmaps etc.) would reflect the inclusion of RUV. But it doesn't. I'm pretty sure I'm running the code correctly. I've also used a very high k value to make the changes obvious (although it looks like the data needs it).
So when does the effect of adding the sources of variation show up? Is it just in the results?
Here is the code:
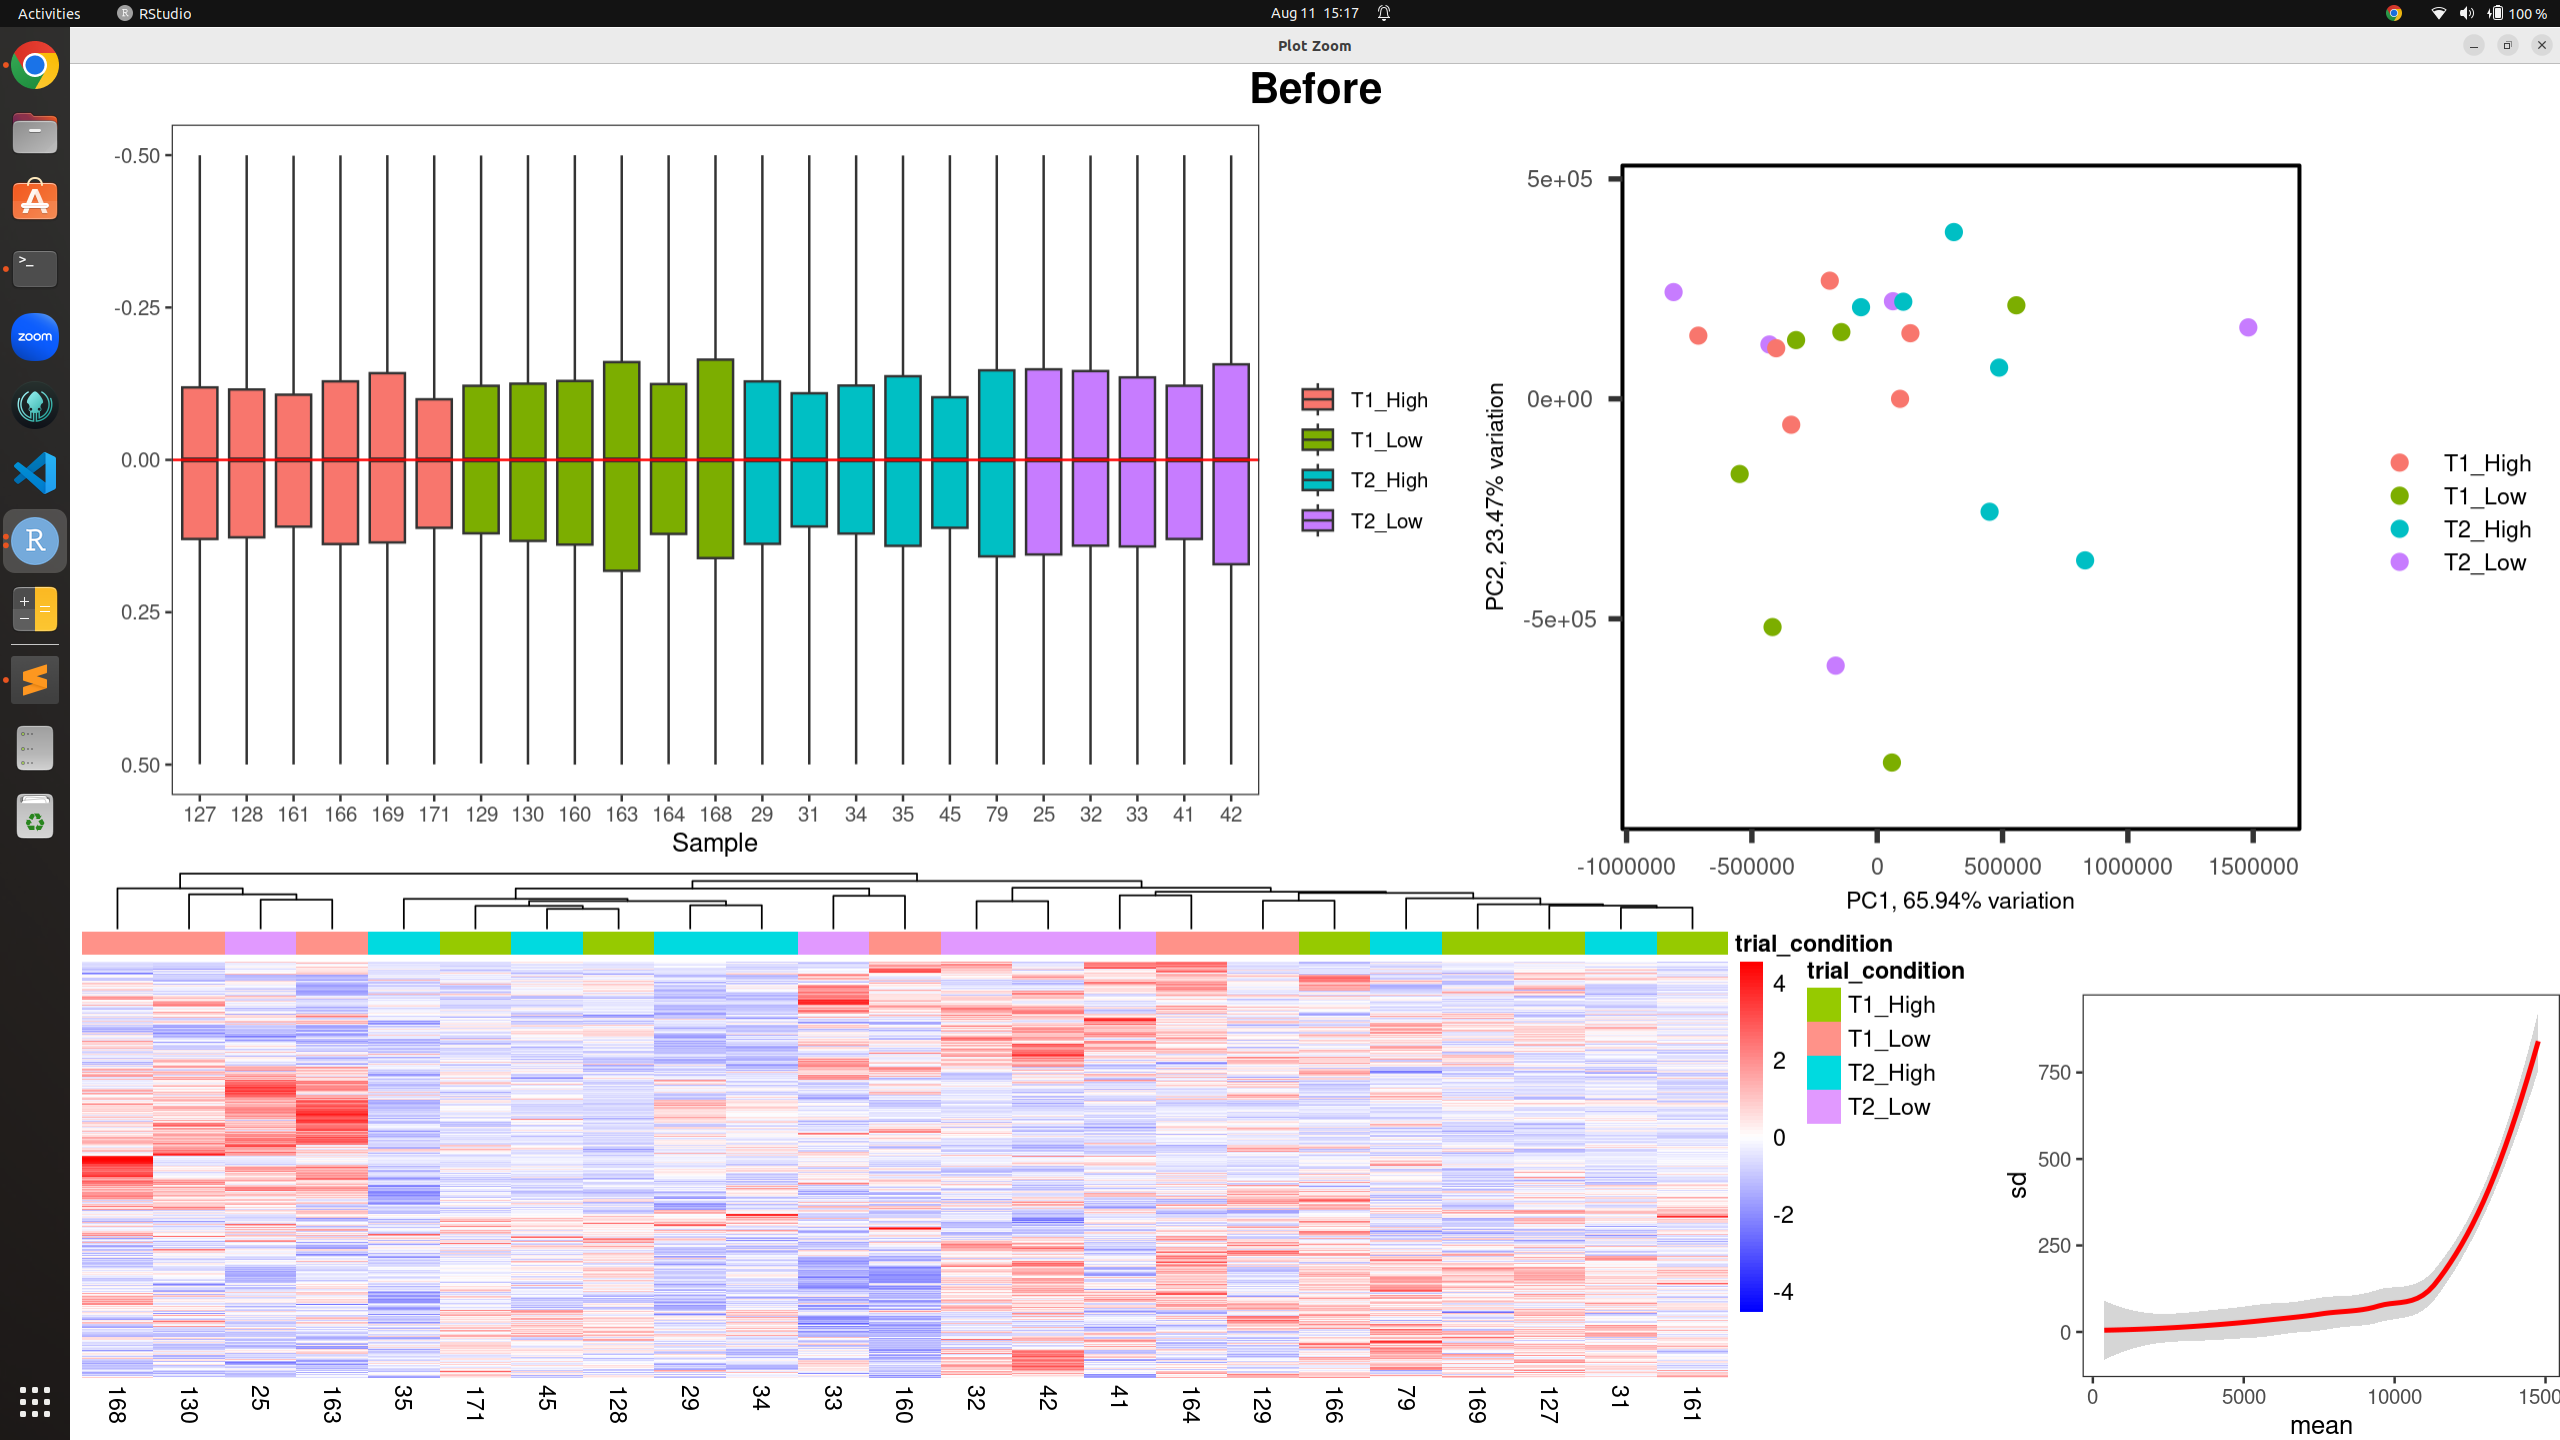
# Before RUVs:
dds <- DESeqDataSetFromMatrix(countData = raw,
colData = metadata,
design = ~trial + trial:condition)
dds <- dds[rowSums(counts(dds) >= 10) >= 5,]
dds <- DESeq(dds)
all_plots(counts(dds, normalized = TRUE), metadata, "trial_condition", -0.5, 0.5, "Before")
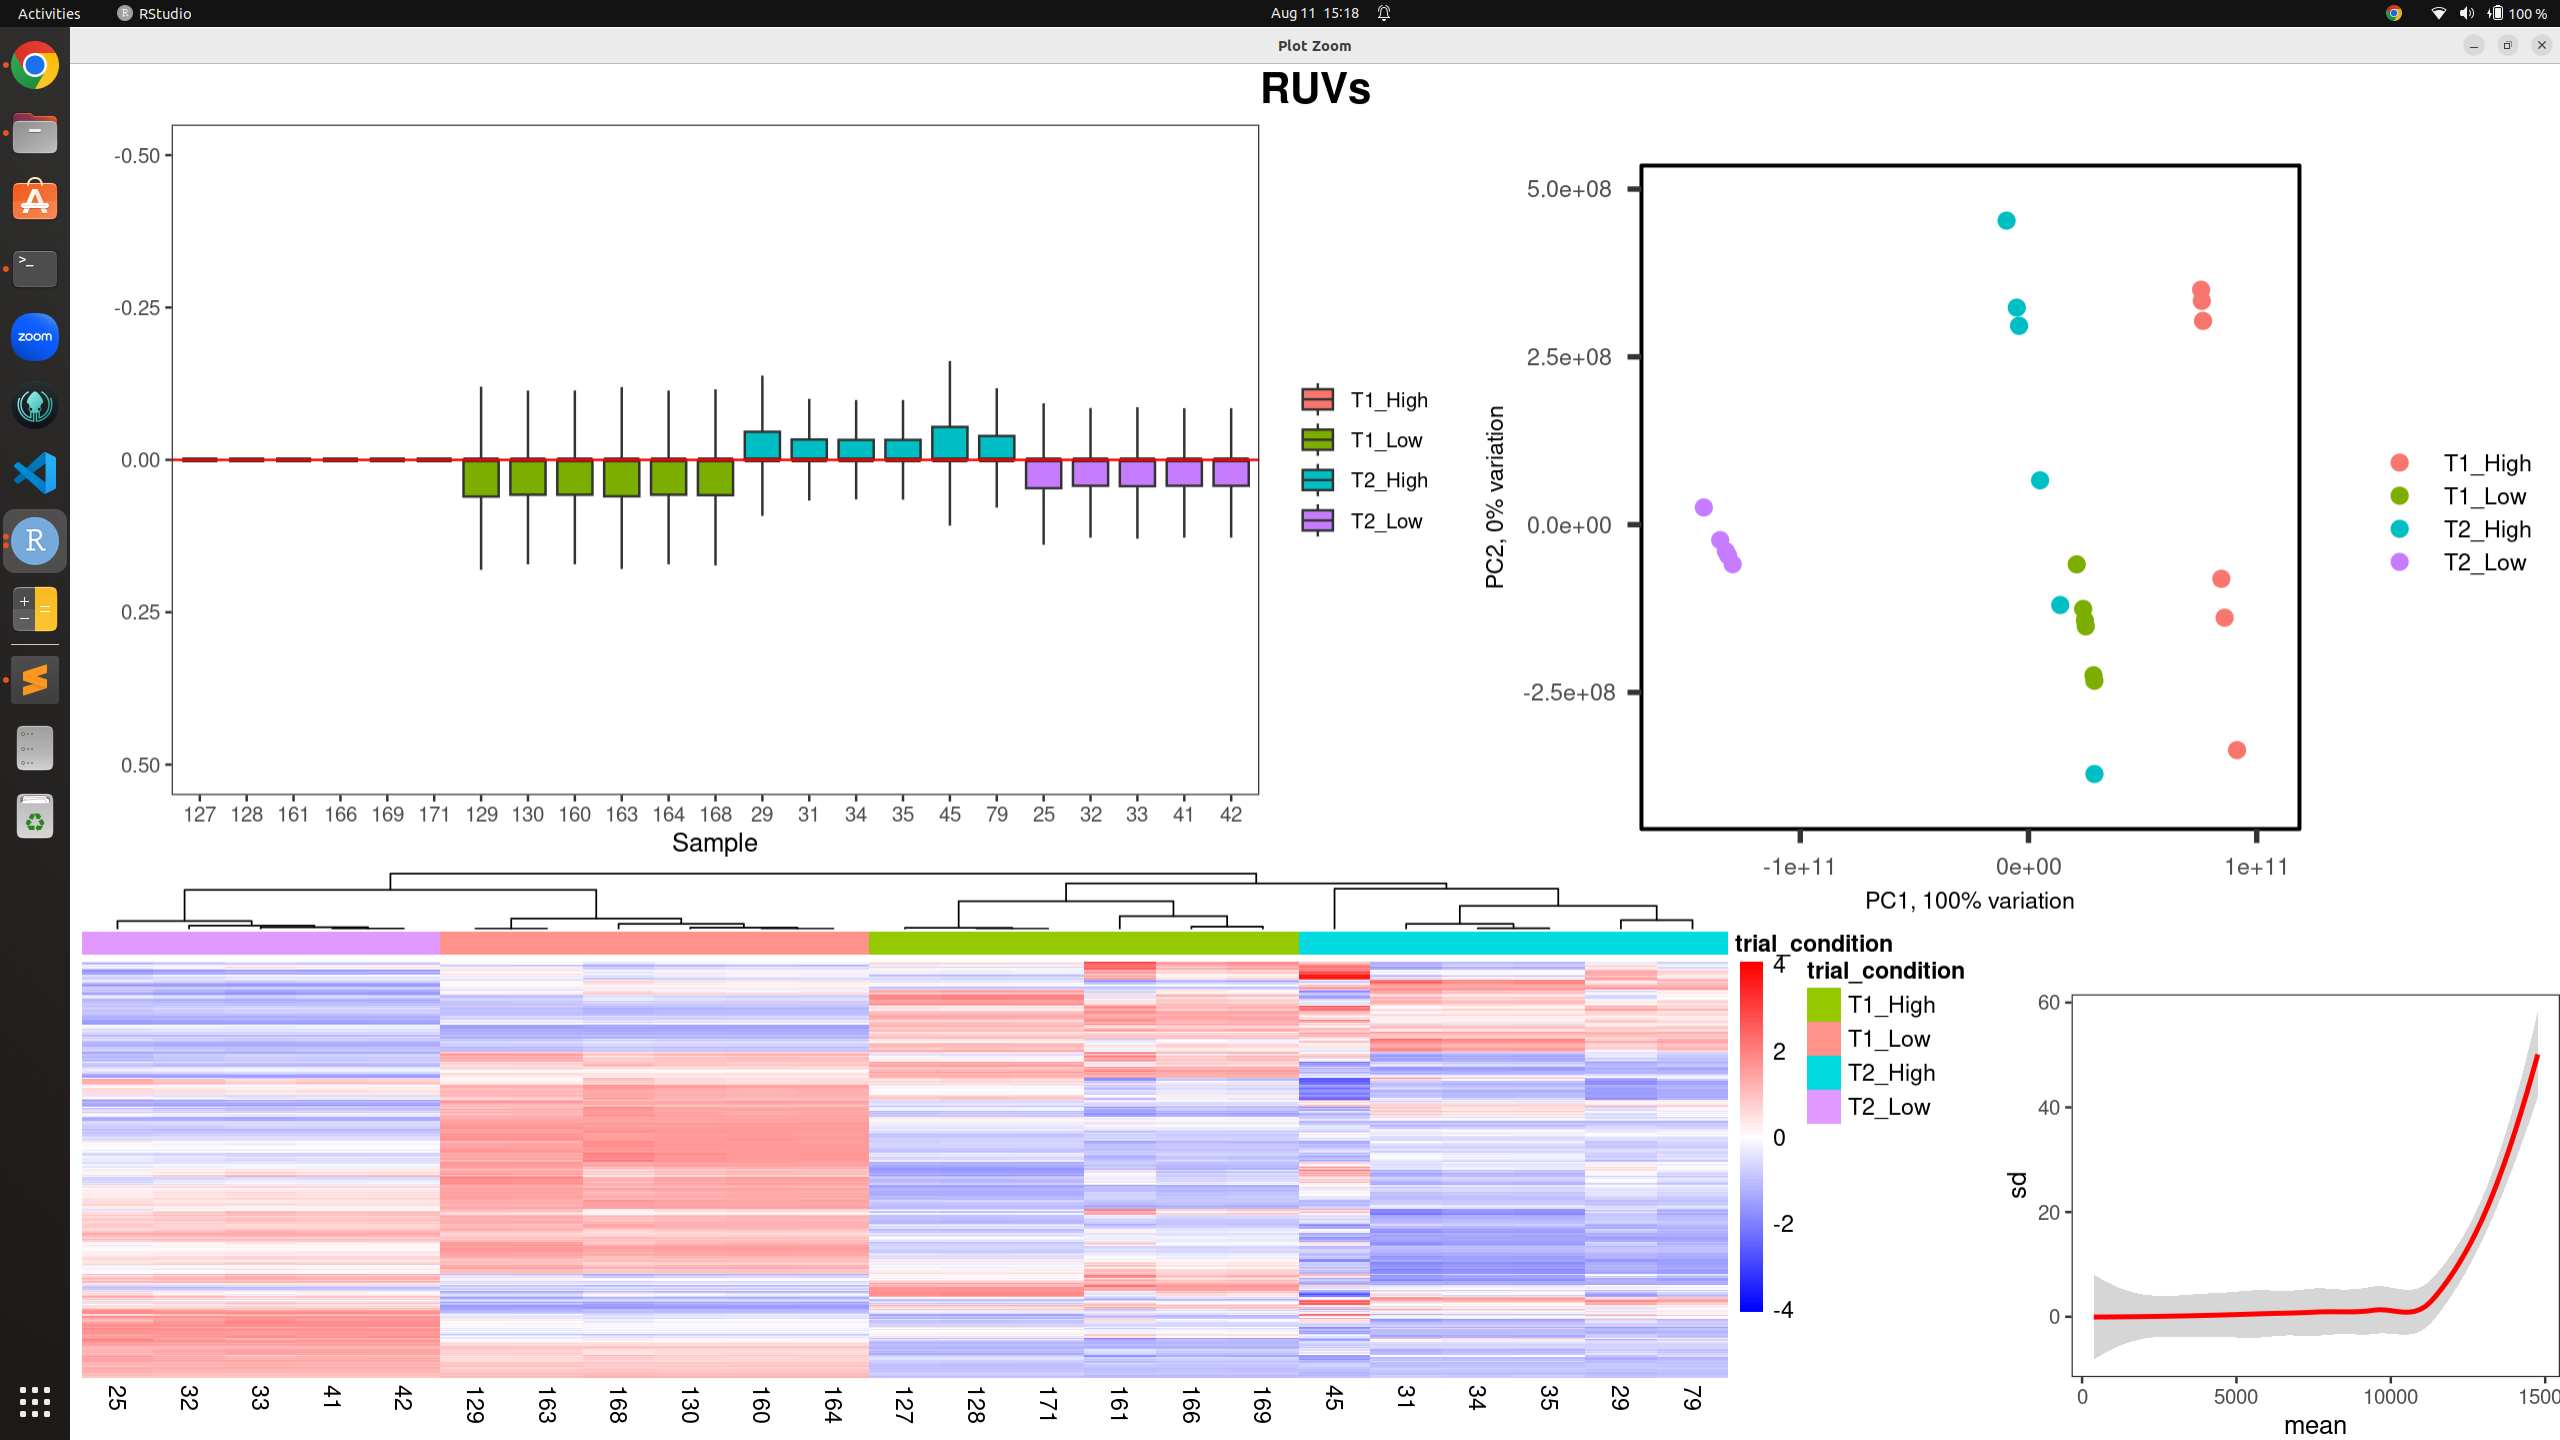
# RUVs
set <- newSeqExpressionSet(counts = raw, phenoData = metadata)
differences <- makeGroups(metadata$trial_condition)
set_s <- RUVs(x = set, cIdx = rownames(set), k = 18, differences)
all_plots(normCounts(set_s), metadata, "trial_condition", -0.5, 0.5, "RUVs")
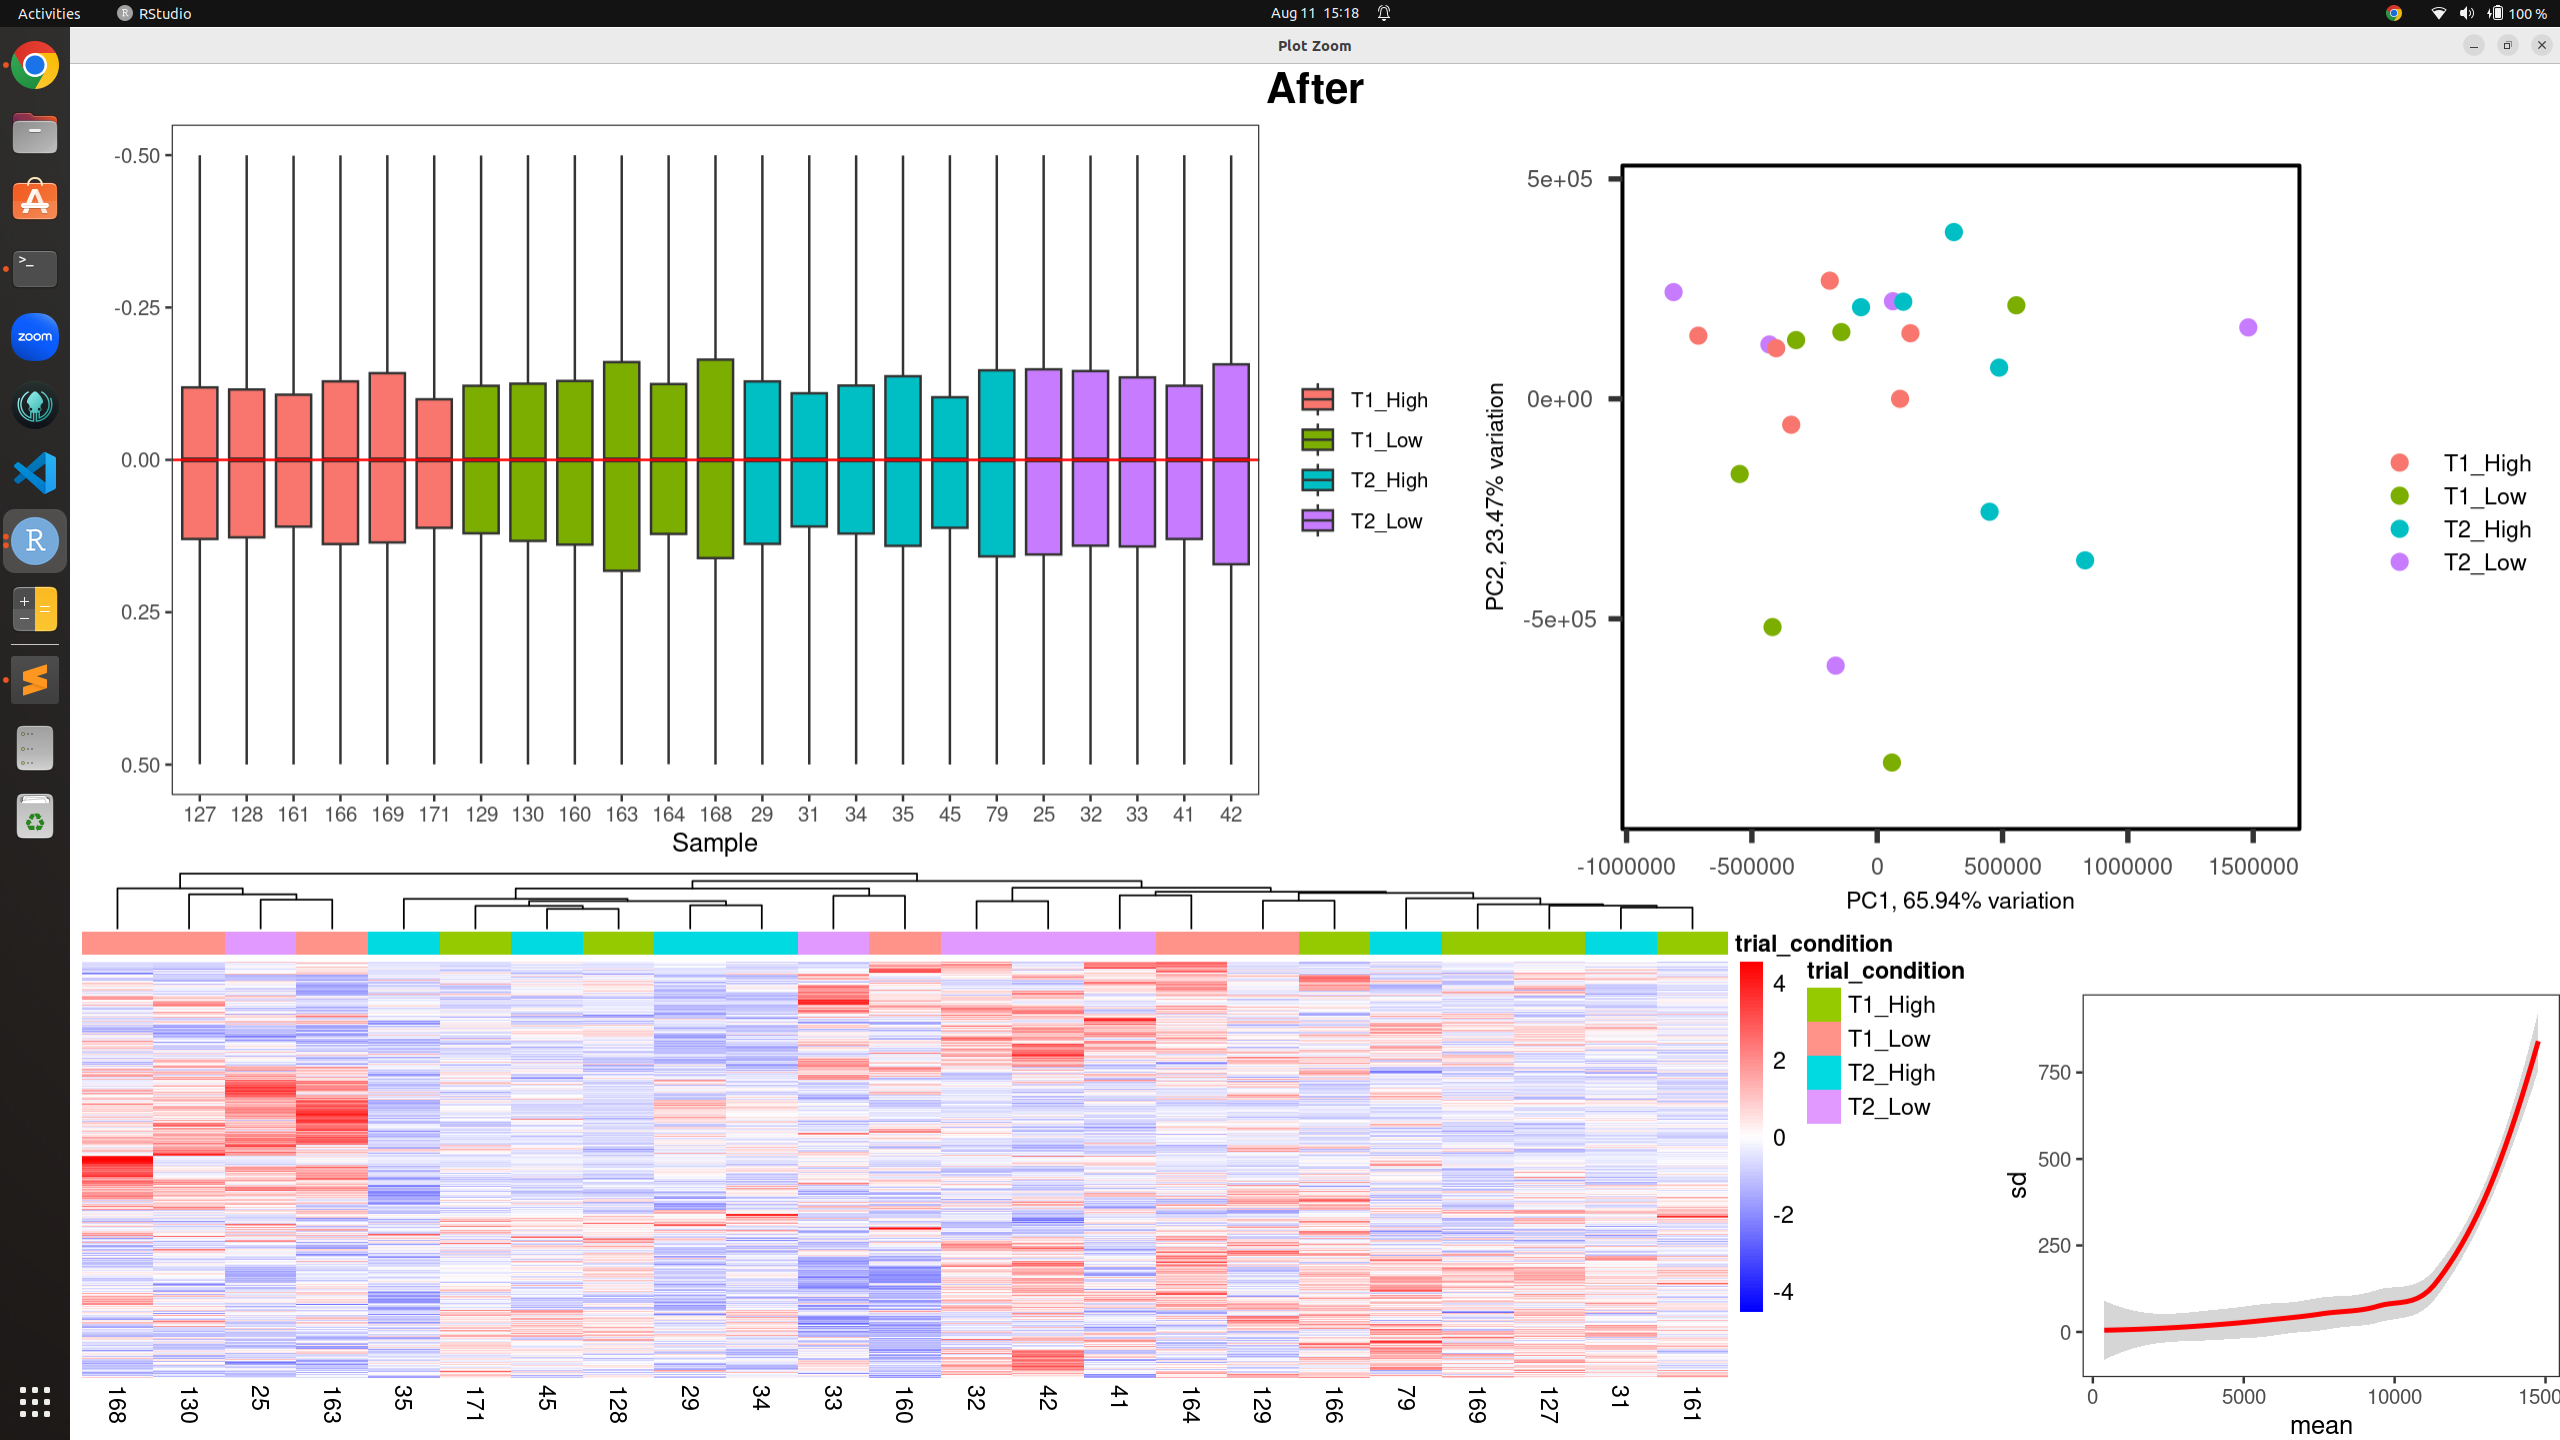
# After RUVs:
dds <- DESeqDataSetFromMatrix(countData = counts(set_s),
colData = pData(set_s),
design = ~trial + trial:condition + W_1 + W_2 + W_3 + W_4 + W_5 + W_6 +
W_7 + W_8 + W_9 + W_10 + W_11 + W_12 + W_13 + W_14 + W_15 +
W_16 + W_17 + W_18
)
dds <- dds[rowSums(counts(dds) >= 10) >= 5,]
dds <- DESeq(dds)
all_plots(counts(dds, normalized = TRUE), metadata, "trial_condition", -0.5, 0.5, "After")
Before RUV:
RUV:
After RUV:

Thank you! I didn't see that.