Entering edit mode

I was following the OSCA book with one sample from my data that is from a pdx model, and when I arrived to the feature selection chapter and checked the mean/variance figure I got this:
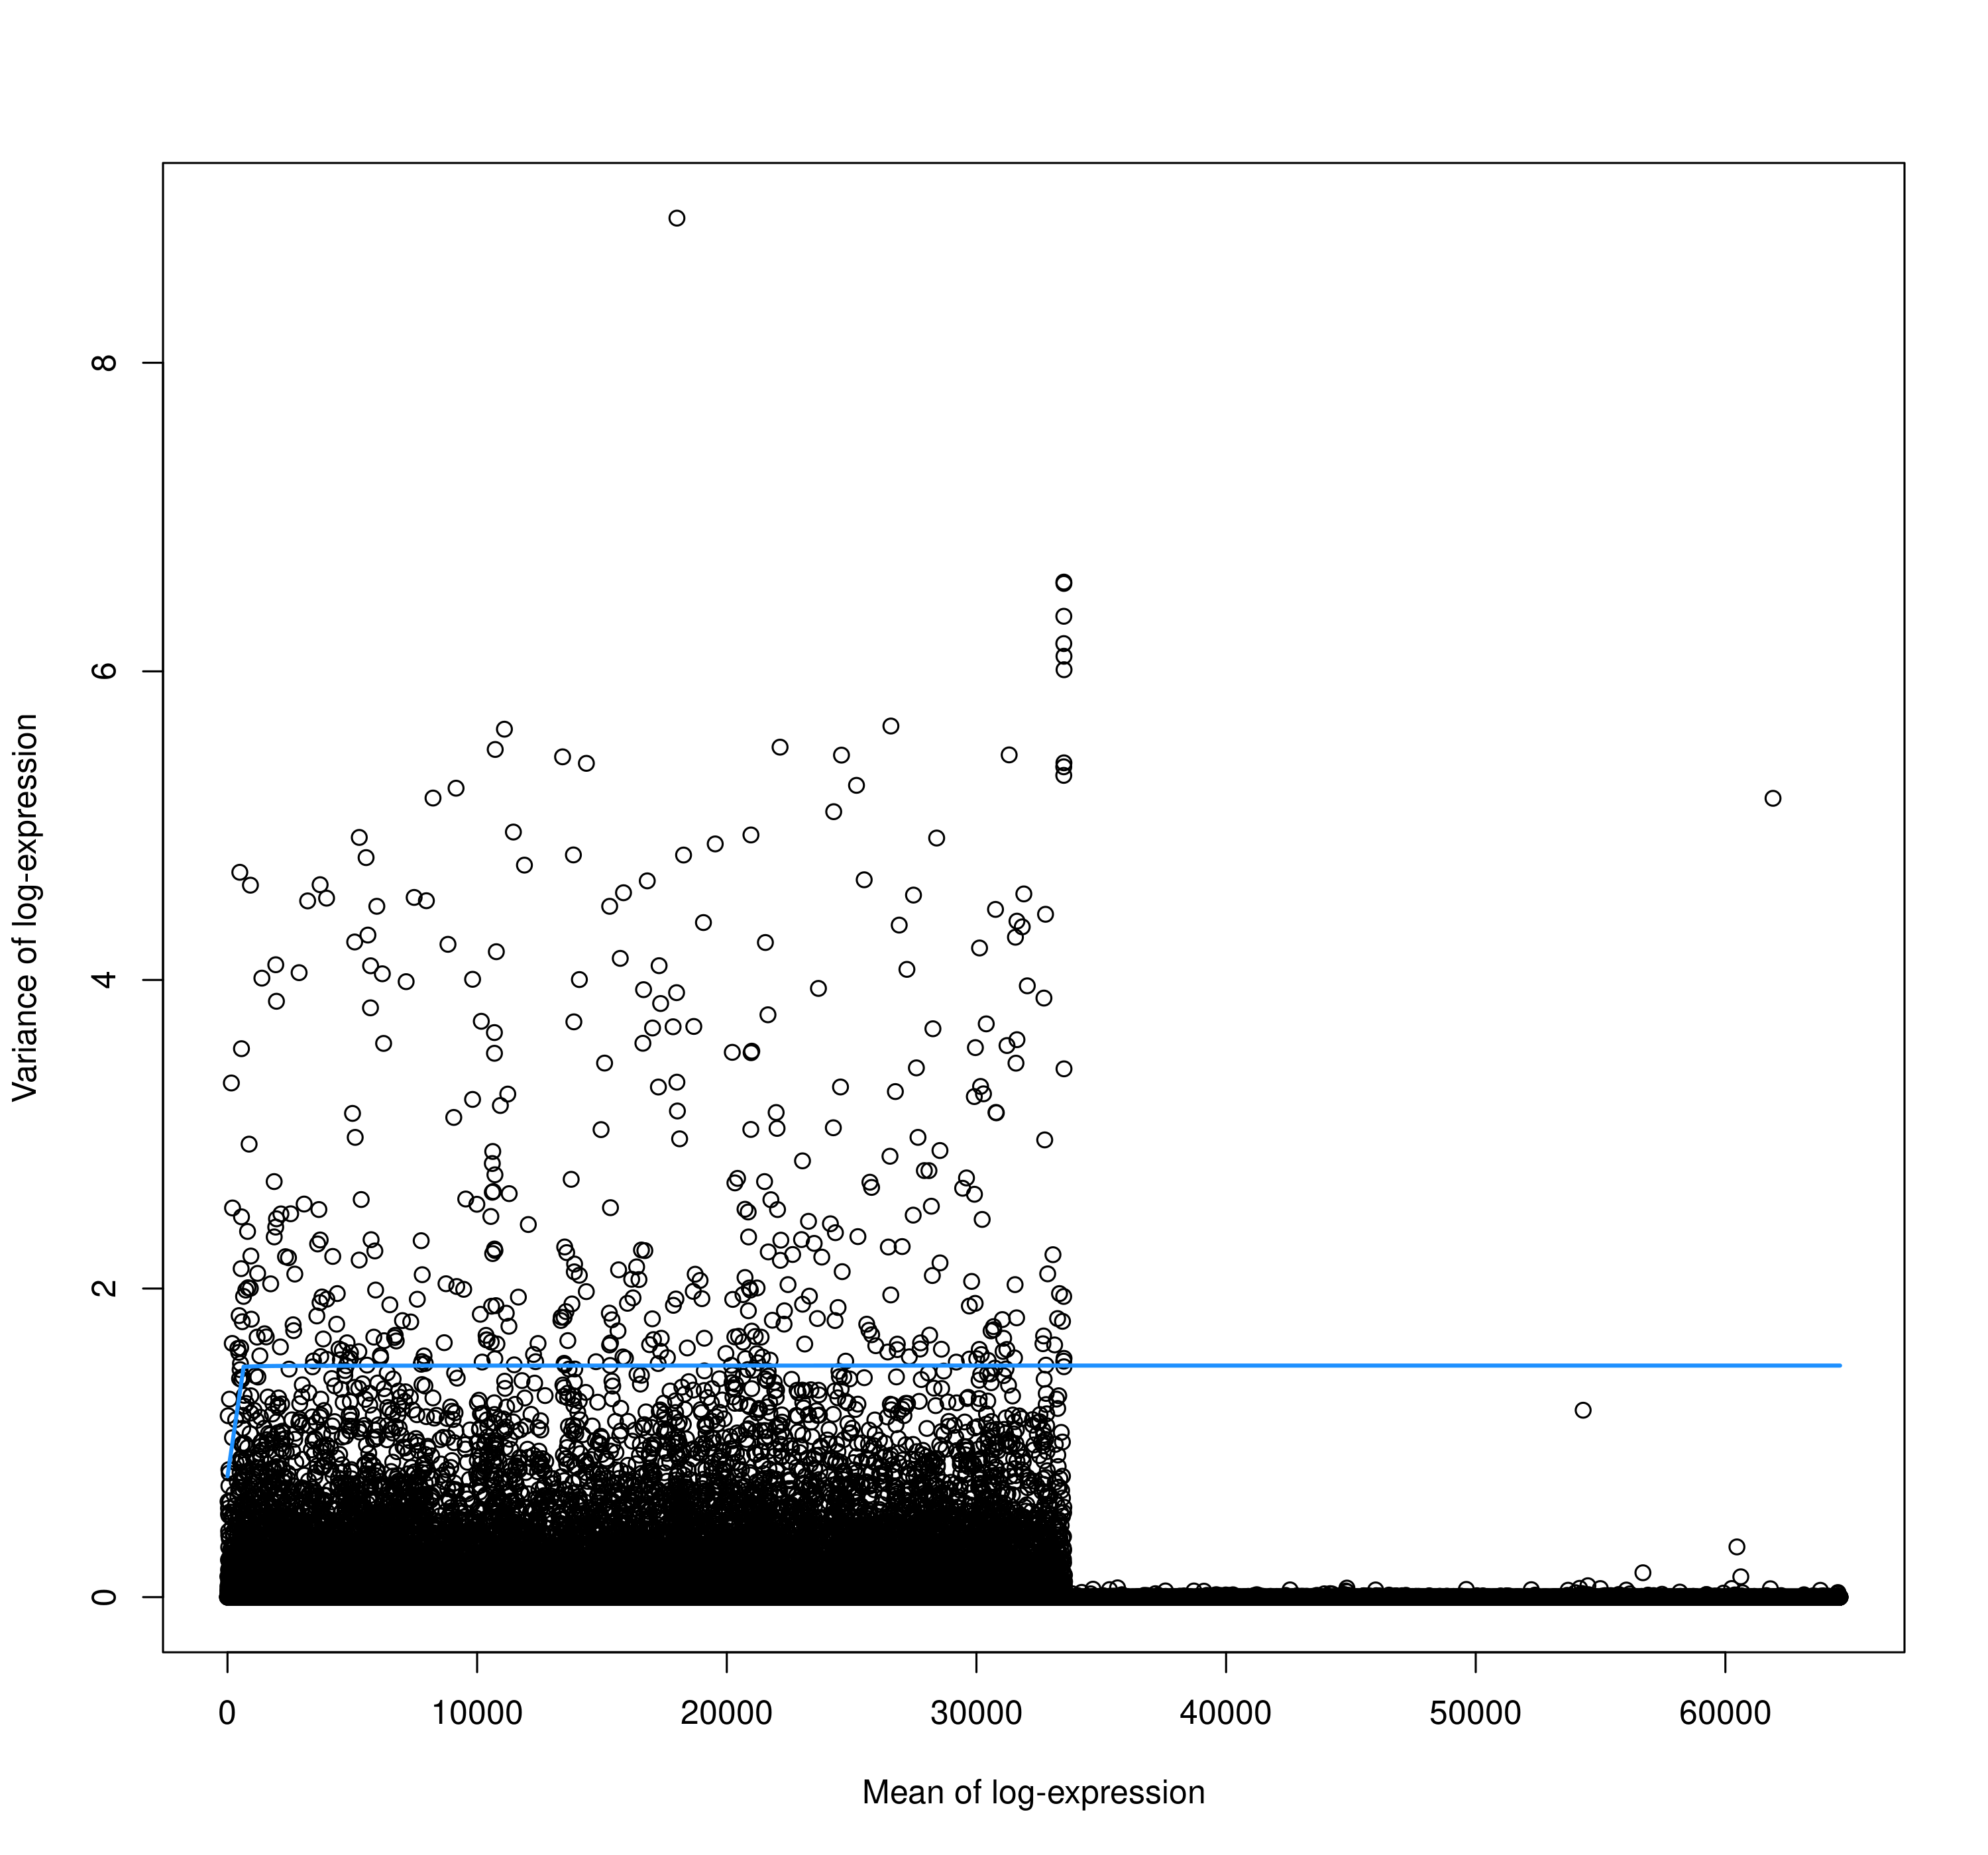
It is very strange for me that mean of log-expression seems to be in the tens of thousands. The code that I have use:
sc_test <- read10xCounts(here("filtered_feature_bc_matrix"))
is.ribo <- rowData(sc_test) %>%
  as_tibble() %>%
  pull(Symbol) %>%
  str_detect("GRCh38_RP[LS]")
is.mito <- rowData(sc_test) %>%
  as_tibble() %>%
  pull(Symbol) %>%
  str_detect("GRCh38_MT-")
is.mouse <- rowData(sc_test) %>%
  as_tibble() %>%
  pull(Symbol) %>%
  str_detect("mm10___")
sc_test <- addPerCellQCMetrics(sc_test, subsets = list(Mito = is.mito, Mouse = is.mouse, Ribo = is.ribo))
colnames(colData(sc_test))

reasons <- perCellQCFilters(sc_test,
  sub.fields = c("subsets_Mito_percent", "subsets_Mouse_percent", "subsets_Ribo_percent")
)
colSums(as.matrix(reasons))
sc_test$discard <- reasons$discard
filtered <- sc_test[, !reasons$discard]

filtered <- logNormCounts(filtered)
# filtered <- logNormCounts(filtered, size.factors = lib.sf.test, transform = "log")
assayNames(filtered)
sizeFactors(filtered) %>% summary()
rownames(filtered) <- rowData(filtered)$Symbol %>% str_remove("GRCh38_")
# feature selection
dec.filt <- modelGeneVar(filtered)
filt.hvgs <- getTopHVGs(dec.filt, prop = 0.1)

fit.filt <- metadata(dec.filt)

png(
  filename = here(fig_folder, "fit_filt.png"),
  width = 3000, height = 2800, res = 300
)
plot(fit.filt$mean, fit.filt$pvar,
  xlab = "Mean of log-expression",
  ylab = "Variance of log-expression"
)
curve(fit.filt$trend(x), col = "dodgerblue", add = TRUE, lwd = 2)
dev.off()
So my main question is if I am missing some important filtering step, or log transformation is not working properly? As these results seem quite odd.
Are you able to share the data, or a subset of it, that reproduces the issue?
Unfortunately not as these are patient data. I will see how I can make a mock based on them and update it here.
So it was a typo after all... fit.filt$pvar, ->
fit.filt$varStrange thing is it didn't fail.