
Hi, I working with a DESeq2 data set and I am using the package EnhancedVolcano to visualize my data. This is one example:
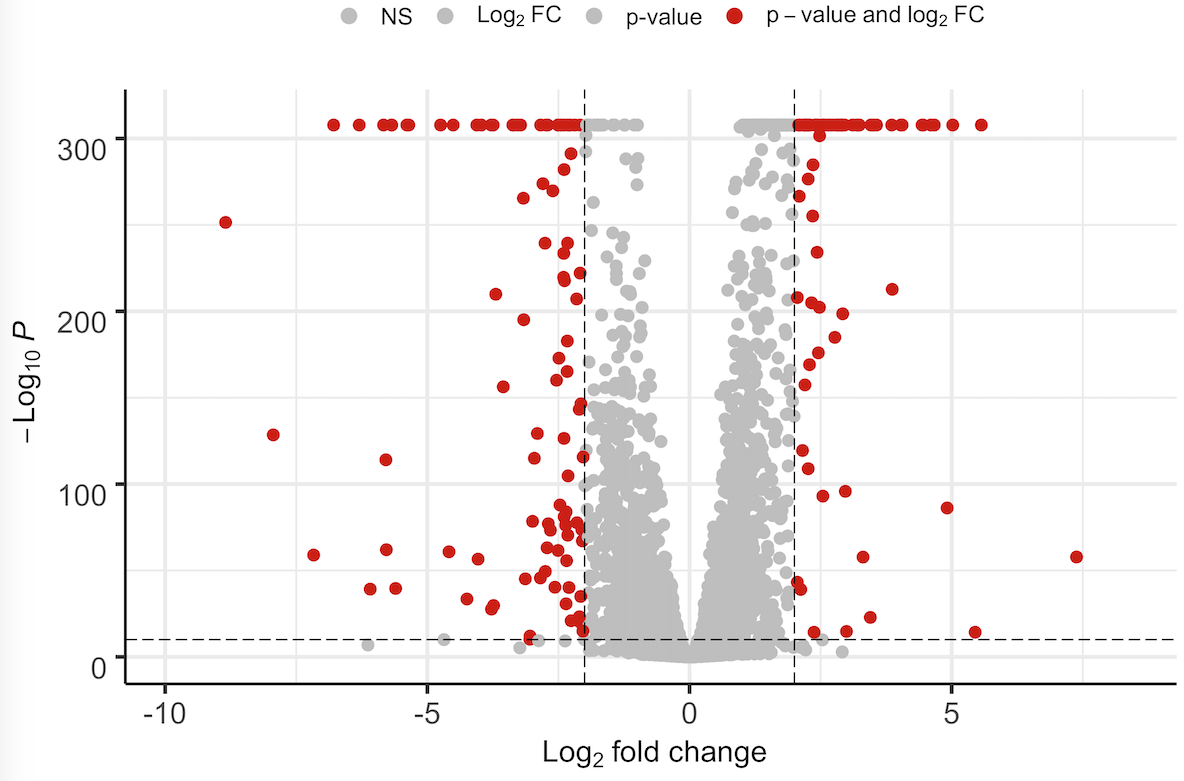
As you can see some of the genes have such a low p-value that DESeq2 places 0. This does not look very nice in the plot - said my PI. I guess there are two ways to address this issue (which is not really an issue rather than an aesthetic thing): Either in DESeq2 by calculating the exact p-value if possible or by placing randomly very low p-values or in EnhancedVolcano by applying some kind of jitter function to the values of the y-axis. I know that EnhancedVolcano is based on ggplot2 and there is the function called geom_jitter() but I am not able to apply it to my data.
Please let me know if you need more information or data. Thank you guys in advance!
Cheers, Philipp

Hey, just a quick feedback. I managed by following the description in the link: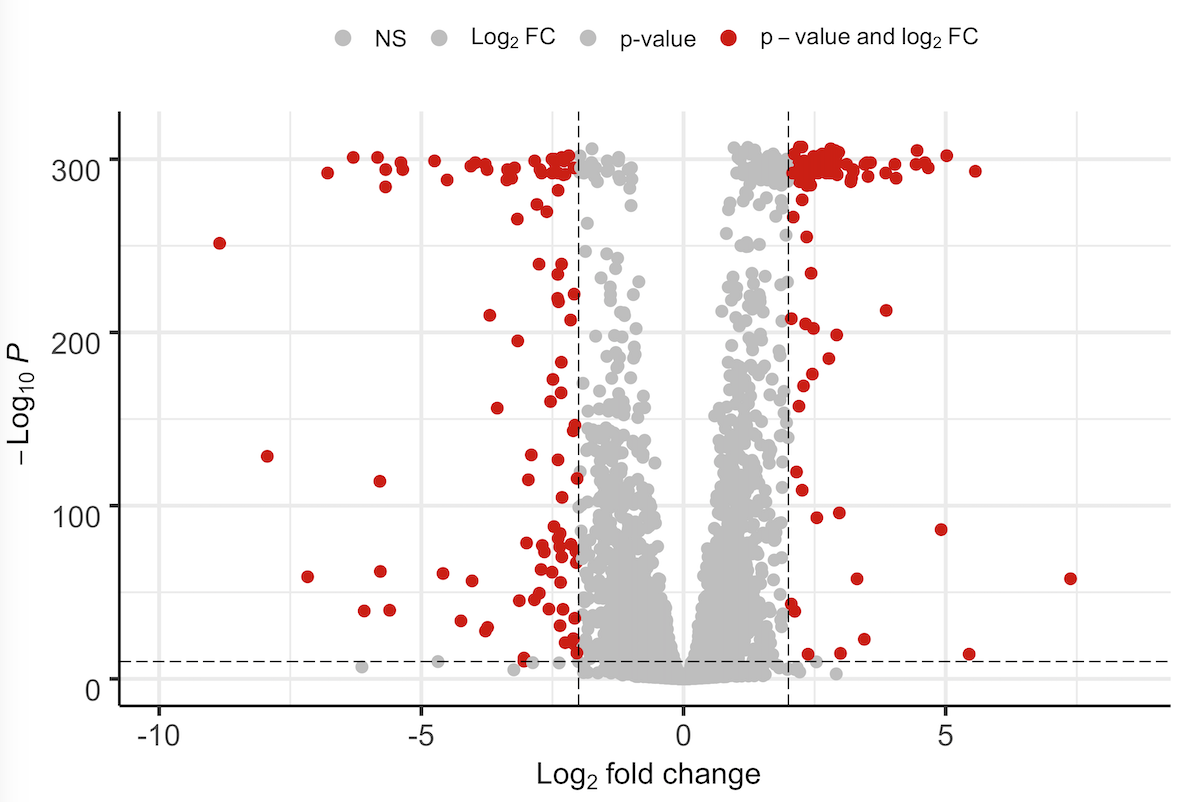
I guess it can be done in a more elegant way. But it does the job for me. I also noticed that numbers lower than 1e-320 or so are automatically set to 0. I do not know why.
Again, thank you so much for your help and these great packages!
Cheers, Philipp
At some point R will represent a small p-value with 0.
Just for the EnhancedVolcano part, this may very well work and is worth a try:
Thanks for your quick response. I tried that already but I did not really understand what actually happened in the resulting plot: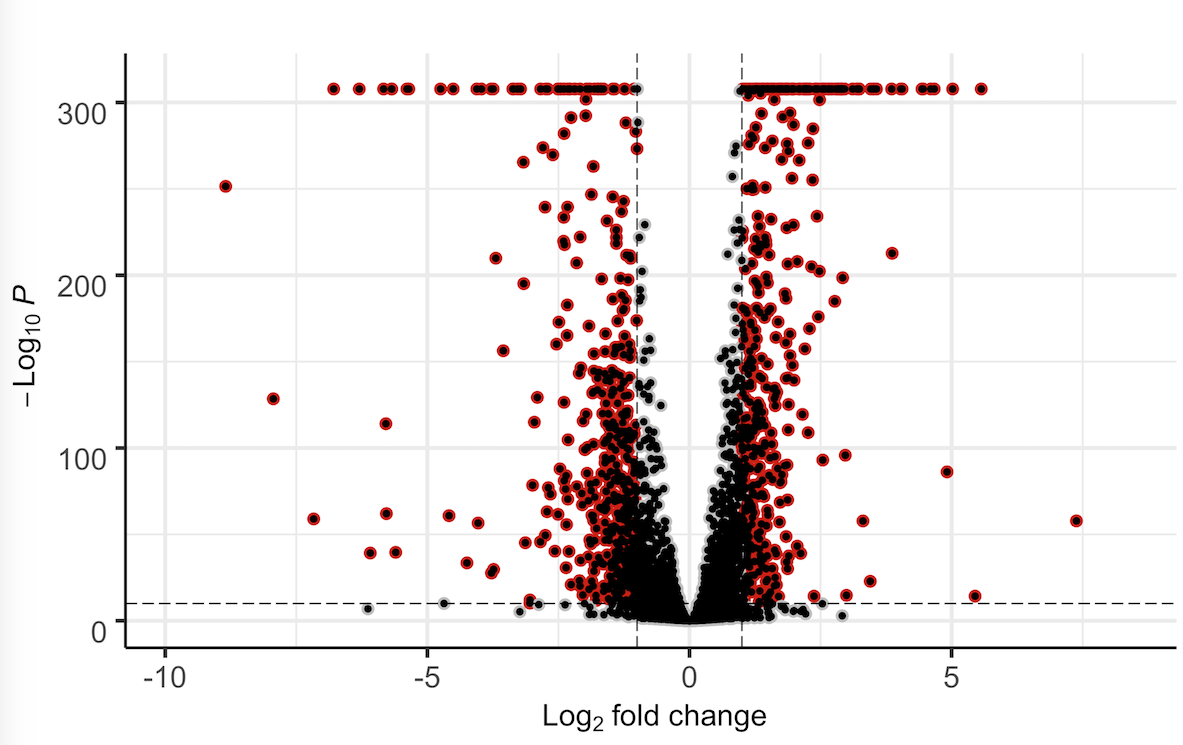
Ah, I see what happened there -
geom_jitter()just adds a default black dot over the original geom points. You may need something like:We are somewhat getting into a rabbit hole, though. If your supervisor is merely worried about aesthetics, then I would respond with this: good science and data does not have to be aesthetically pleasing.
haha, I will relay it to him.
Great, thanks a lot! I might not be able to apply that to my data though but I will give it a try.