
I use the DEP package for label-free proteomics analysis. Differential expression (test_diff) results provide p-values (p.val) and FDR values (p.adj), the latter are calculated by fdrtool using moderated t-statistics of empirical Bayes (eBayes function in limma) as input. What is a reason to use the moderated t-statistic, not p-value, to compute FDRs?
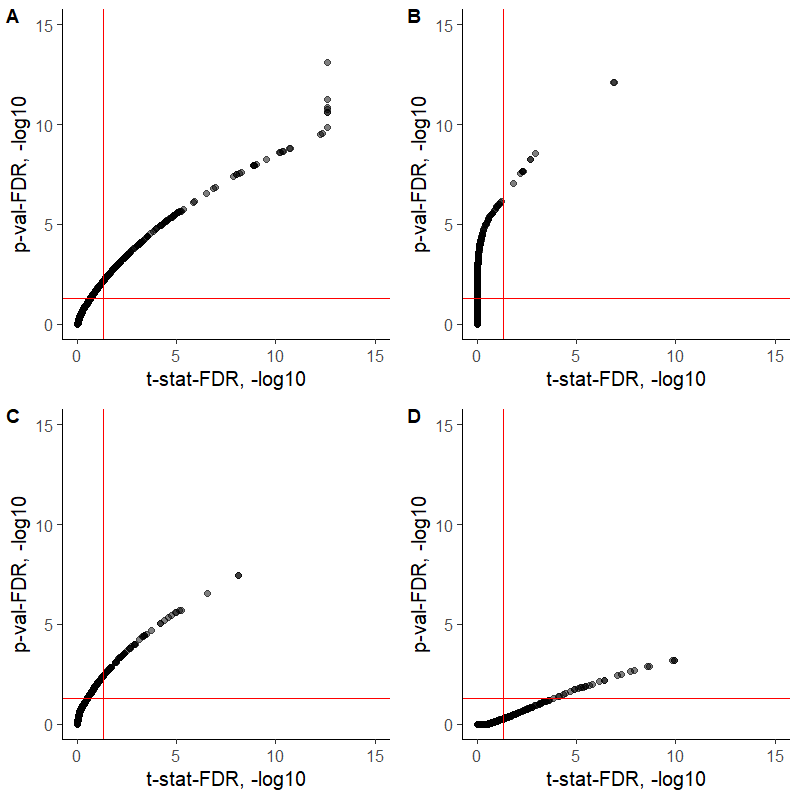
The relations between the t-statistic-derived FDRs and the FDRs calculated by adjusting the p-values using the BH method (with p.adjust(method = "BH") or with fdrtool::fdrtool(statistic = "pvalue")) seem to depend on a contrast of interest, for some comparisons the t-statistic FDR delivers more differentially expressed proteins, whereas for others the p-value-based FDR provides a lower cut-off (see the figure for 4 different contrasts). I would highly appreciate some feedback regarding those differences. Are both procedures correct to apply for FDR calculations?
Very good question that you have asked. I stumbled upon your post when I was searching for the exact information that you have described. I would appreciate if someone can shed a light here.
Same here. I also have no idea why
fdrtoolis being applied in the t-statistic.