I have pretty simple but probably weird question. I have complex design with interaction terms in my model (see below), I run DESeq2_1.20.0 on rna-seq data. It seems that I can't change my contrasts to end up using only apeglm shrinkage and lfcThreshold, instead I'm stuck with using ashr shrinkage method without being able to incorporate lfcThreshold into calculation of null.
What bothers me is that all published papers are using simple comparisons, at least in plant science, but all, test against non-zero log fold change. If me using ashr shrinkage and definitely avoiding doing any post-hoc on lfc, how can I justify not incorporating lfcThreshold?
previously suggested by Michael L. model matrix for my study.
mm <- model.matrix(~cltv + cltv:time + cond:cltv:time, data=colData(dds))
You can either: use an lfcThreshold with apeglm by re-arranging terms such that your contrast is represented by a single coefficient (some strategies are in the vignette), or if this isn't clear how to do and you can't find someone to guide you through re-arranging the coefficients, you can avoid LFC shrinkage and use results() with lfcThreshold, so providing an FDR controlled list of genes with LFC > some value. If you go with the latter, you can just use a higher threshold on counts (e.g. X or more samples with a count of 10 or more) in order to remove the genes with noisy LFC.
Hi!
I think I have a similar problem. I'm using contrasts, and therefore can't use apeglm.
If I use results() with lfcthreshold in 0.585 and alpha 0.05, I get almost 2500 DEGS. If I use lfcshrink type ashr, without filtering by pvalue and lfcthreshold I get 6000 DEGS. I understand that this is because I'm testint it for LFC = 0 and the p value is set a 0.1.
What I don't quite understand is if It is correct to use the results function, do the contrast and set the p value to 0.05, threshold to 0.585, and then use lfcshrink type "ashr" and use res = with the results function that I did before. If I do this, I get the same number of DEGS but the MA plots look like this:
Results
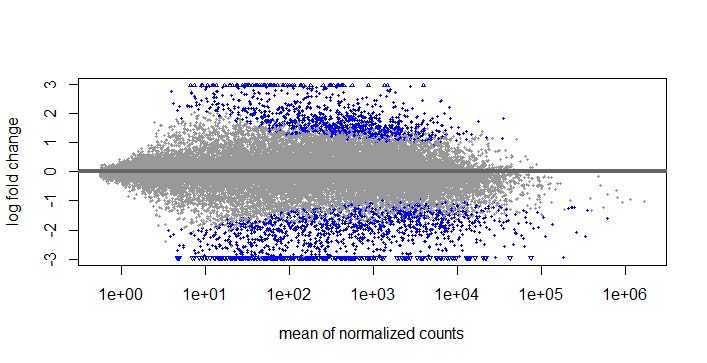
LFCshrink
If I use this type of lfcshrink, should I use s-values o p-values?
I'm thinking that if this is not allright, I will have to use results and set the pvalue and lfcthreshold as you suggested before.
Sorry if you have already answered this!
Thanks for all the help, the answers are really helpfull!
I recommend to use ashr and s-value here. There is nothing wrong with using this approach. You are controlling the aggregate false sign rate (probability of getting a sign wrong in the set with s-value < X).
It appears you have many DE genes, and you can rank the significant ones by the LFC, as it is a posterior estimate and not an MLE.
I set svalue=TRUE and I got different numbers of DE genes, from 2500 with p value 0.05, to 5000 with s value lower than 0.005 with LFC>1 and LFC<-1. Is that usual? From what I understand the s value and p value are different, if I want to compare LFC between diferent contrasts, should the pvalue be enough?
For me the binarization of DE and the counts on either side is not really relevant/interesting, once you have thousands. Clearly you have thousands of genes affected by condition no matter if you have null hypothesis testing or Bayesian approach. I would focus on the LFC itself as a more interesting measure of the experiment.


Hi! I think I have a similar problem. I'm using contrasts, and therefore can't use apeglm.
If I use results() with lfcthreshold in 0.585 and alpha 0.05, I get almost 2500 DEGS. If I use lfcshrink type ashr, without filtering by pvalue and lfcthreshold I get 6000 DEGS. I understand that this is because I'm testint it for LFC = 0 and the p value is set a 0.1.
What I don't quite understand is if It is correct to use the results function, do the contrast and set the p value to 0.05, threshold to 0.585, and then use lfcshrink type "ashr" and use res = with the results function that I did before. If I do this, I get the same number of DEGS but the MA plots look like this: Results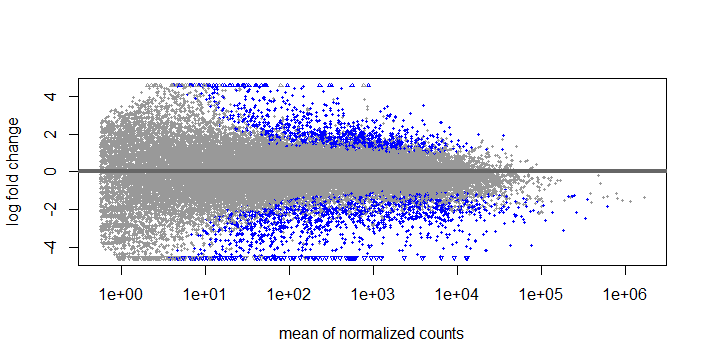 LFCshrink
If I use this type of lfcshrink, should I use s-values o p-values? I'm thinking that if this is not allright, I will have to use results and set the pvalue and lfcthreshold as you suggested before.
Sorry if you have already answered this! Thanks for all the help, the answers are really helpfull!
I recommend to use ashr and s-value here. There is nothing wrong with using this approach. You are controlling the aggregate false sign rate (probability of getting a sign wrong in the set with s-value < X).
It appears you have many DE genes, and you can rank the significant ones by the LFC, as it is a posterior estimate and not an MLE.
Thank you Michael!
I set svalue=TRUE and I got different numbers of DE genes, from 2500 with p value 0.05, to 5000 with s value lower than 0.005 with LFC>1 and LFC<-1. Is that usual? From what I understand the s value and p value are different, if I want to compare LFC between diferent contrasts, should the pvalue be enough?
For me the binarization of DE and the counts on either side is not really relevant/interesting, once you have thousands. Clearly you have thousands of genes affected by condition no matter if you have null hypothesis testing or Bayesian approach. I would focus on the LFC itself as a more interesting measure of the experiment.