How to work with duplicates calculating the differentially expressed genes in PseudoBulk-singleCell RNA experiment using zinbwave?
1
0
Entering edit mode
Assa Yeroslaviz ★ 1.5k
@assa-yeroslaviz-1597
Last seen 3 months ago
Germany

I would like to test the zinbwave package with my data, but not sure, what is the correct procedure for that.

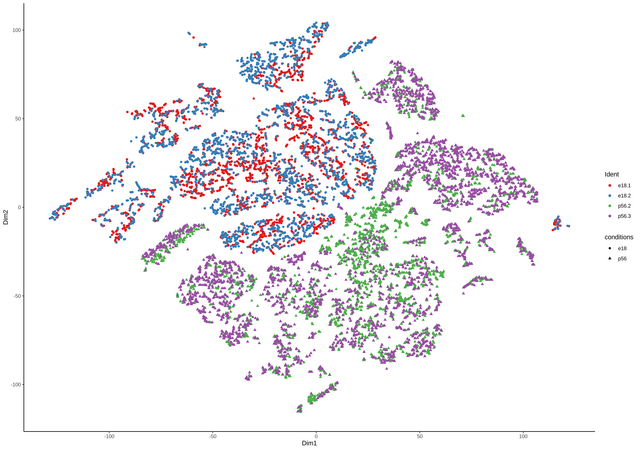
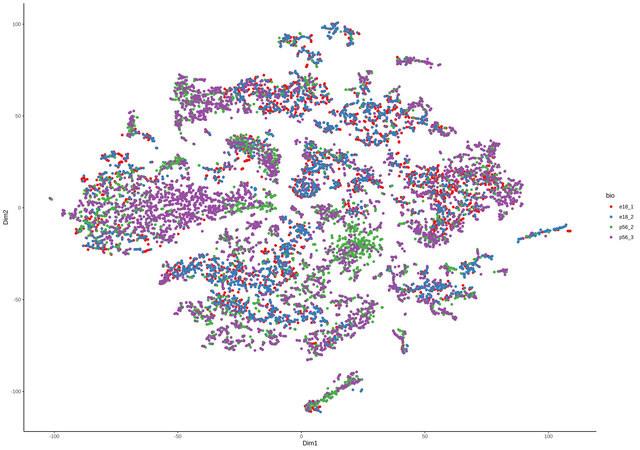
We have several experimental conditions/timepoints sequenced by 10x and would like to compare them against each other. They are all in duplicates (two biological replicates for each TP).

How would one go ahead with duplicated? Do I need to merge the two biological replicates into one sample and then continue to work with it as one, or is there a way to classify them as belonging to the same condition, when doing the DE analysis?

Would it be better first to use Seurat to integrate each two conditions (so four samples) to prevent possible batch effects into one integratedData object, keeping the project.Ident in place so they can be compared?

thanks

scRNA zinbwave batch IntegratedData • 1.7k views
ADD COMMENT
0
Entering edit mode

continuing the discussion from github, thanks Davide for the great package. comment from Davide

zinbwave can account for batch effects by adding a batch variable in the design matrix.

That usually works well, so my suggestion would be, assuming you have (or can create) a SingleCellExperiment object for each of your biological replicate, to simply concatenate the objects into one large SingleCellExperiment object. You can simply use cbind() for that, making sure that the rowData are compatible.

Once you have your large dataset, you can add a couple of variables to the colData, e.g., condition and patient.

You can use Seurat's integration as an alternative, but it won't be easy to integrate zinbwave downstream of that. So my recommendation would be to stick to one or the other.

Perhaps you could also have a look at the muscat Bioconductor package (https://bioconductor.org/packages/release/bioc/html/muscat.html) which sounds like a better approach for your multi-sample design.

ADD REPLY
0
Entering edit mode

So I was wondering how to proceed with my data-

I have had already the data merged in Seurat and than converted to a singleCellExperiment object containing all four samples. The Coldata contains the data from the Seurat object as well, including the origin (orig.ident) of the samples (see below).

I can add another column with the name for the two groups, something like e.g.

colData(sce)$group <- c(rep("e18",3310 + 3000), rep("p53", 3639+ 4238))

the number are the lengths of the four single samples for each group.

Then when running the zinbwave command

This is what I did

zinb <- zinbFit(sce, K=0, epsilon=1000)
sce_zinb <- zinbwave(sce, fitted_model = zinb, K = 0, epsilon=1000)

Or should I use K=2 as I have two groups?

But based on your recommendation, should I try now

zinb <- zinbFit(sce, K=0, epsilon=1000)
sce_zinb <- zinbwave(sce, X="~group", fitted_model = zinb, K = 0, epsilon=1000)

Would this be the correct appraoch to compensate for possible bias due to the differences in the samples?

thanks again Assa

> colData(sce)
DataFrame with 14187 rows and 12 columns
                      orig.ident nCount_RNA nFeature_RNA  mitoRatio
                     <character>  <numeric>    <integer>  <numeric>
AAACCCAAGATGCAGC-1_1       e18_1      29913         5654  0.0378765
AAACCCACAAGCTCTA-1_1       e18_1       3270         1753  0.0825688
AAACCCAGTTTCGTTT-1_1       e18_1       3444         1741  0.1062718
AAACGAAGTGCCTTTC-1_1       e18_1       7301         2844  0.0610875
AAACGAATCTACCAGA-1_1       e18_1      26740         5980  0.0242708
...                          ...        ...          ...        ...
                     Scrublet_doublet_score Scrublet_predicted_doublet
                                  <numeric>                <character>
AAACCCAAGATGCAGC-1_1              0.0345173                      False
AAACCCACAAGCTCTA-1_1              0.0116643                      False
AAACCCAGTTTCGTTT-1_1              0.0112072                      False
AAACGAAGTGCCTTTC-1_1              0.0116643                      False
AAACGAATCTACCAGA-1_1              0.0359924                      False
...                                     ...                        ...
                      Scrublet_barcodes nCount_SCT nFeature_SCT
                            <character>  <numeric>    <integer>
AAACCCAAGATGCAGC-1_1 AAACCCAAGATGCAGC-1       9147         3150
AAACCCACAAGCTCTA-1_1 AAACCCACAAGCTCTA-1       6920         2068
AAACCCAGTTTCGTTT-1_1 AAACCCAGTTTCGTTT-1       6978         1985
AAACGAAGTGCCTTTC-1_1 AAACGAAGTGCCTTTC-1       7674         2842
AAACGAATCTACCAGA-1_1 AAACGAATCTACCAGA-1       9207         3467
...                                 ...        ...          ...
ADD REPLY
1
Entering edit mode
davide risso ▴ 950
@davide-risso-5075
Last seen 5 weeks ago
University of Padova

Hi Assa,

Your zinbwave code is almost correct, the X argument should go into the zinbFit call. As we state in the paper and vignette, when computing observational weights, you want to set epsilon to a much greater value (and you want to set observationalWeights=TRUE).

As I said on github, I would include the group variable in the zinbwave call. Moreover, if you are not planning to reuse the model fit, you can simply call zinbwave skipping zinbFit.

Putting all toghether:

sce_zinb <- zinbwave(sce, X="~group", K = 0, observationalWeights=TRUE, epsilon=1e12).

If you only want to use zinbwave to compute the observational weights, K=0 is correct. You can specify K>0 if you want to use zinbwave also to infer a low-dimensional representation of your data, which might be good to see whether the cells from the four samples are distributed in any meaningful way (e.g., they cluster by treatment).

What I don't know is what Seurat "integration" does to your data. I.e., you have to make sure that the resulting SingleCellExperiment object contains the raw counts in the counts assay. Otherwise the results from zinbwave will be nonsensical.

ADD COMMENT
0
Entering edit mode

plotting the reducedDim() of my merged (top image) vs. the IntegratedData (bottom image) show a complete different behavior of the samples. What I am not sure about here is which of the two should be "better" ( if one can even ask such a question), in terms of differential expression analysis.

I will test also the DE analysis with and without the X=~group parameter and try to understand the difference between the results and which one is making more sense.

In the merged data set, I can see a clear separation between the e18 and the p53 samples, based on the samples themselves. But the differences are gone in the integrated data set below.

What I don't know is what Seurat "integration" does to your data. I.e., you have to make sure that the resulting SingleCellExperiment object contains the raw counts in the counts assay. Otherwise the results from zinbwave will be nonsensical.

based on the count values, I guess this are the raw counts, but thanks for mentioning this. I will check this as well.

assay(E18_P56.doubRemoved.sct.Integrated.sce)[1:10,1:10]
10 x 10 sparse Matrix of class "dgCMatrix"
   [[ suppressing 10 column names ‘AAACCCAAGATGCAGC-1_1’, ‘AAACCCACAAGCTCTA-1_1’, ‘AAACCCAGTTTCGTTT-1_1’ ... ]]

Xkr4     . . . . . . . . . .
Gm1992   . . . . . . . . . .
Mrpl15   1 . . 3 3 1 . . 2 4
Tcea1    . . . 1 3 1 2 . . 4
Rgs20    . . . . . . . . 1 .
Atp6v1h  4 . . 1 . 1 . 1 . 2
Oprk1    . . . . . . . . . .
Rb1cc1   7 1 2 1 5 . . 1 6 2
St18    10 . 1 . . . . . 4 3
Pcmtd1   1 . . 2 1 1 1 . 2 2

merged Data tSNE

Integrated Data

ADD REPLY

Login before adding your answer.

Traffic: 946 users visited in the last hour
Help About
FAQ
Access RSS
API
Stats

Use of this site constitutes acceptance of our User Agreement and Privacy Policy.

Powered by the version 2.3.6