openCyto: usage and visualization of quadGate.tmix / collapsing data for flowClust
3
0
Entering edit mode
@viktor-thiel-9079
Last seen 2 days ago
Sweden

Hello everybody,


I have recently started using BioConductor and its flow packages in particular and now would like to learn openCyto. I have a very simple four-color panel for testing purposes. For one of my gating steps, I would like to use the quadGate.tmix method, since the populations are bleeding into each other a little. During my odyssey through the farthest reaches of the internet, I stumpled upon this issue on github: https://github.com/RGLab/flowWorkspace/issues/175

The image on there shows pretty much exactly what I want to achieve, but unfortunately, I have a hard time figuring out how to use the command to actually produce a filter object I can use. Running the quadGate.tmix function with usePrior="no" returns "A list of 4 filters applied to a flowFrame.", which, as far as I understand, contains the four polygon gates defining the quadrants. How do I succesfully apply this to a flowFrame, and how can I visualize it? I can kind of get it to work if I use as filter the first element of the resulting list:

xyplot(`Pacific Blue-A` ~ `PE-A`, testframe, filter=testfilter[[1]])

This results in the following:


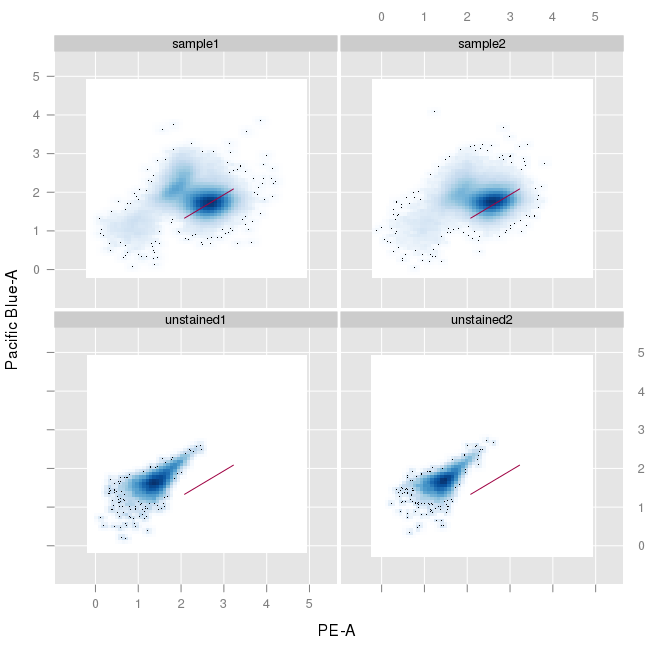
How do I get that to display the full quadrants to me? Also, the thresholding is obviously off, presumably because I ran the filter without any prior. I could not really find any info on that. Maybe I did not look hard enough, but I would much appreciate it if you could point me towards useful resources.


On a different note, I alternatively tried an approach using flowClust. In the openCyto gating template, I set collapseDataForGating to TRUE for this step and was under the impression that this would result in the same gate for all samples. The actual output, however, looks like this:


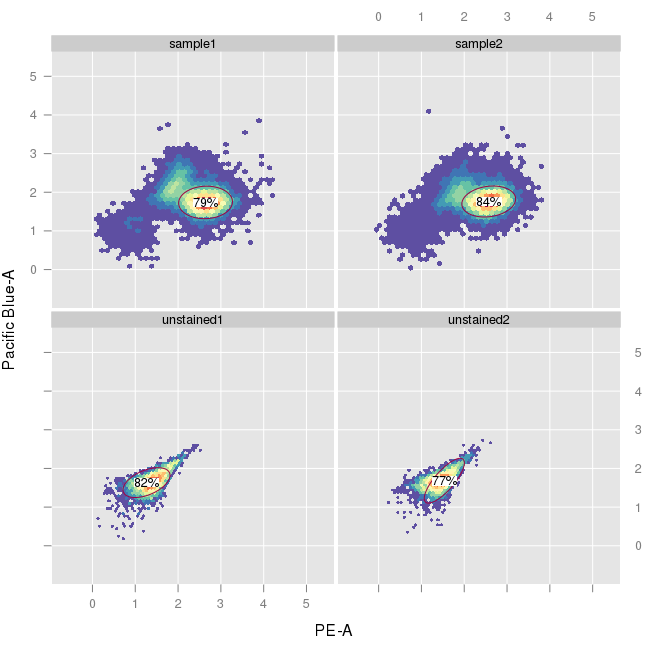
Is there a way to generate a common gate?


I thank you in advance for any help you can provide. I am aware that these are not very specialised questions and that I am probably missing some fundamental concepts here, still I would very much appreciate some useful pointer.

Best,

VT

flowclust opencyto opencyto gating • 2.8k views
ADD COMMENT
2
Entering edit mode
Greg Finak ▴ 240
@greg-finak-4299
Last seen 7.3 years ago
United States

I've done some testing, I believe the tmixfilter is broken.. I dont' have more specific details yet. A call to flowClust on the flowFrame works without issue.


ADD COMMENT
0
Entering edit mode

Turns out to be a bug in `quadGate.tmix` function, I've pushed the fix to openCyto 1.8.3.

As shown in  http://rpubs.com/wjiang2/132387You should set `K` appropriately to achieve the best results.

Note, If you want to speed up flowClust, you can pass a smaller `B` value to 'quadGate.mix`. (default is 500). But you will have to tweak it to see whether it affects the outcome, 


ADD REPLY
0
Entering edit mode

Brilliant, thank you! Your help is highly appreciated. I am still at the very beginning of getting to terms with the flow packages, but I hope to use them to their full potential soon. Thanks for your work.

ADD REPLY
1
Entering edit mode
Jiang, Mike ★ 1.3k
@jiang-mike-4886
Last seen 2.6 years ago
(Private Address)

Here is from the doc '?quadGate.tmix':

Value

filters object that contains four polygonGates following the order of (-+,++,+-,–)

That said, the results you've got should be ready to plot as it is. i.e.

library(openCyto)
library(flowClust)
testfilter <- quadGate.tmix(fr, c("PE-A", "Pacific Blue-A"), K = 3, usePrior = "no", prior = list())


xyplot(`Pacific Blue-A` ~ `PE-A`, testframe, filter=testfilter)

Regarding to 'collapseDataForGating', it should be used in conjunction with 'groupBy'.  See package vignette for more details https://www.bioconductor.org/packages/release/bioc/vignettes/openCyto/inst/doc/openCytoVignette.html.


ADD COMMENT
0
Entering edit mode

Thank you for your reply! Please excuse my delayed reaction.
I can, in fact, plot the quadGate the way you described. I don't know why I missed that. However, it still does not display more than the one diagonal line, as shown in the image in my original post. I would also highly value your input on potential variables to investigate to adjust. I tried playing around with the K, target and quantile arguments, but that resulted in mediocre success.

Choosing a groupBy variable for flowClust did help, thank you!

ADD REPLY
1
Entering edit mode

What's your sessionInfo()? Try to update your openCyto to the latest release (1.8.2) if you are using the older version.

ADD REPLY
0
Entering edit mode

I was running openCyto 1.8.0, but I updated it to 1.8.2 now. Unfortunately, the problem with visualizing the quadGate still persists. sessionInfo() output:

locale:
 [1] LC_CTYPE=en_US.UTF-8       LC_NUMERIC=C              
 [3] LC_TIME=en_GB.UTF-8        LC_COLLATE=de_DE.UTF-8    
 [5] LC_MONETARY=de_DE.UTF-8    LC_MESSAGES=en_US.UTF-8   
 [7] LC_PAPER=en_US.UTF-8       LC_NAME=C                 
 [9] LC_ADDRESS=C               LC_TELEPHONE=C            
[11] LC_MEASUREMENT=de_DE.UTF-8 LC_IDENTIFICATION=C       

attached base packages:
[1] parallel  stats     graphics  grDevices utils     datasets  methods  
[8] base     

other attached packages:
 [1] openCyto_1.8.2            flowClust_3.8.0          
 [3] clue_0.3-50               corpcor_1.6.8            
 [5] mnormt_1.5-3              ellipse_0.3-8            
 [7] RBGL_1.46.0               graph_1.48.0             
 [9] Biobase_2.30.0            BiocGenerics_0.16.1      
[11] flowWorkspace_3.16.3      gridExtra_2.0.0          
[13] ncdfFlow_2.16.0           BH_1.58.0-1              
[15] RcppArmadillo_0.6.200.2.0 flowViz_1.34.0           
[17] lattice_0.20-33           flowCore_1.36.1          
[19] ks_1.10.0                 rgl_0.95.1367            
[21] mvtnorm_1.0-3             misc3d_0.8-4             
[23] KernSmooth_2.23-15        BiocInstaller_1.20.1     

loaded via a namespace (and not attached):
 [1] splines_3.2.2         R.utils_2.1.0         gtools_3.5.0         
 [4] assertthat_0.1        stats4_3.2.2          latticeExtra_0.6-26  
 [7] mvoutlier_2.0.6       robustbase_0.92-5     chron_2.3-47         
[10] digest_0.6.8          RColorBrewer_1.1-2    colorspace_1.2-6     
[13] Matrix_1.2-2          R.oo_1.19.0           plyr_1.8.3           
[16] multicool_0.1-9       pcaPP_1.9-60          XML_3.98-1.3         
[19] fda_2.4.4             zlibbioc_1.16.0       scales_0.3.0         
[22] flowStats_3.28.1      ggplot2_1.0.1         hexbin_1.27.1        
[25] proto_0.3-10          magrittr_1.5          IDPmisc_1.1.17       
[28] GGally_0.5.0          R.methodsS3_1.7.0     MASS_7.3-45          
[31] tools_3.2.2           data.table_1.9.6      stringr_1.0.0        
[34] MCMCpack_1.3-3        munsell_0.4.2         cluster_2.0.3        
[37] sgeostat_1.0-26       pls_2.5-0             grid_3.2.2           
[40] tcltk_3.2.2           gtable_0.1.2          codetools_0.2-14     
[43] reshape_0.8.5         DBI_0.3.1             reshape2_1.4.1       
[46] rrcov_1.3-8           R6_2.1.1              robCompositions_1.9.1
[49] dplyr_0.4.3           sROC_0.1-2            Rgraphviz_2.14.0     
[52] stringi_1.0-1         Rcpp_0.12.2           DEoptimR_1.0-4       
[55] coda_0.18-1

ADD REPLY
0
Entering edit mode
Jiang, Mike ★ 1.3k
@jiang-mike-4886
Last seen 2.6 years ago
(Private Address)

Could you please email me one of the example files that I can reproduce what you've seen?

ADD COMMENT

Login before adding your answer.

Traffic: 955 users visited in the last hour
Help About
FAQ
Access RSS
API
Stats

Use of this site constitutes acceptance of our User Agreement and Privacy Policy.

Powered by the version 2.3.6