
I would like to visualize my data using the Heatmap function from the ComplexHeatmap package, which I find to be a very good combination of annotations and expression values in one image.
Unfortunately I am not sure, what I'm doing wrong here. My heatmap shows just one color.
The code to create the Heatmap is
col_fun = colorRamp2(c(-3, 0, 3), c("green", "white", "red"))

Heatmap(mat, name = "expression", km = 8, top_annotation = ha,
    show_row_names = FALSE, show_column_names = FALSE, col=col_fun) +
  Heatmap(expr$gene_biotype, name = "biotype", width = unit(5, "mm"),
          col = circlize::rand_color(length(unique(expr$gene_biotype))) )
mat is a matrix of RNA-Seq expression values, normalized with the DESeq2 package. It contains all significantly deregulated genes (11332 genes with padj <= 0.05).
There are strong fluctuations within the data (see the summary below)
> summary(mat)
  01_Flox_S13         02_Flox_S1        03_Flox_S21        04_Flox_S17        05_Flox_S27       06_Rab7KO23_S28
 Min.   :     0.0   Min.   :     0.0   Min.   :     0.0   Min.   :     0.0   Min.   :     0.0   Min.   :     0.0
 1st Qu.:   241.4   1st Qu.:   248.3   1st Qu.:   241.2   1st Qu.:   245.9   1st Qu.:   244.5   1st Qu.:   257.7
 Median :   990.6   Median :   999.9   Median :   987.7   Median :  1003.4   Median :   992.1   Median :  1031.4
 Mean   :  2505.1   Mean   :  2502.6   Mean   :  2492.8   Mean   :  2515.5   Mean   :  2503.8   Mean   :  2558.4
 3rd Qu.:  2621.8   3rd Qu.:  2653.3   3rd Qu.:  2612.4   3rd Qu.:  2648.7   3rd Qu.:  2637.9   3rd Qu.:  2609.6
 Max.   :274498.5   Max.   :272329.5   Max.   :275464.8   Max.   :265434.6   Max.   :267117.7   Max.   :275797.9
 07_Rab7KO23_S24    08_Rab7KO23_S23    09_Rab7KO23_S29    10_Rab7KO23_S8     11_Rab7KO25_S5     12_Rab7KO25_S19
 Min.   :     0.0   Min.   :     0.0   Min.   :     0.0   Min.   :     0.0   Min.   :     0.0   Min.   :     0.0
 1st Qu.:   256.7   1st Qu.:   254.5   1st Qu.:   256.3   1st Qu.:   252.8   1st Qu.:   260.9   1st Qu.:   255.5
 Median :  1028.7   Median :  1021.7   Median :  1017.2   Median :  1026.0   Median :  1026.5   Median :  1023.3
 Mean   :  2502.9   Mean   :  2507.6   Mean   :  2498.0   Mean   :  2514.1   Mean   :  2540.8   Mean   :  2516.9
 3rd Qu.:  2602.2   3rd Qu.:  2591.6   3rd Qu.:  2584.8   3rd Qu.:  2595.6   3rd Qu.:  2576.9   3rd Qu.:  2608.9
 Max.   :256343.7   Max.   :259078.5   Max.   :250331.2   Max.   :267339.0   Max.   :310160.6   Max.   :301711.7
 13_Rab7KO25_S16    14_Rab7KO25_S15    15_Rab7KO25_S2
 Min.   :     0.0   Min.   :     0.0   Min.   :     0.0
 1st Qu.:   257.8   1st Qu.:   257.2   1st Qu.:   256.7
 Median :  1027.5   Median :  1021.9   Median :  1028.9
 Mean   :  2519.0   Mean   :  2520.9   Mean   :  2513.1
 3rd Qu.:  2599.7   3rd Qu.:  2604.9   3rd Qu.:  2590.6
 Max.   :303185.3   Max.   :299469.0   Max.   :305042.9
The results of this command can be seen to the left in the image below, while the results of my heatmap.2 command is to the right (where the colors are much more distinguish between up- and down-regulated genes).
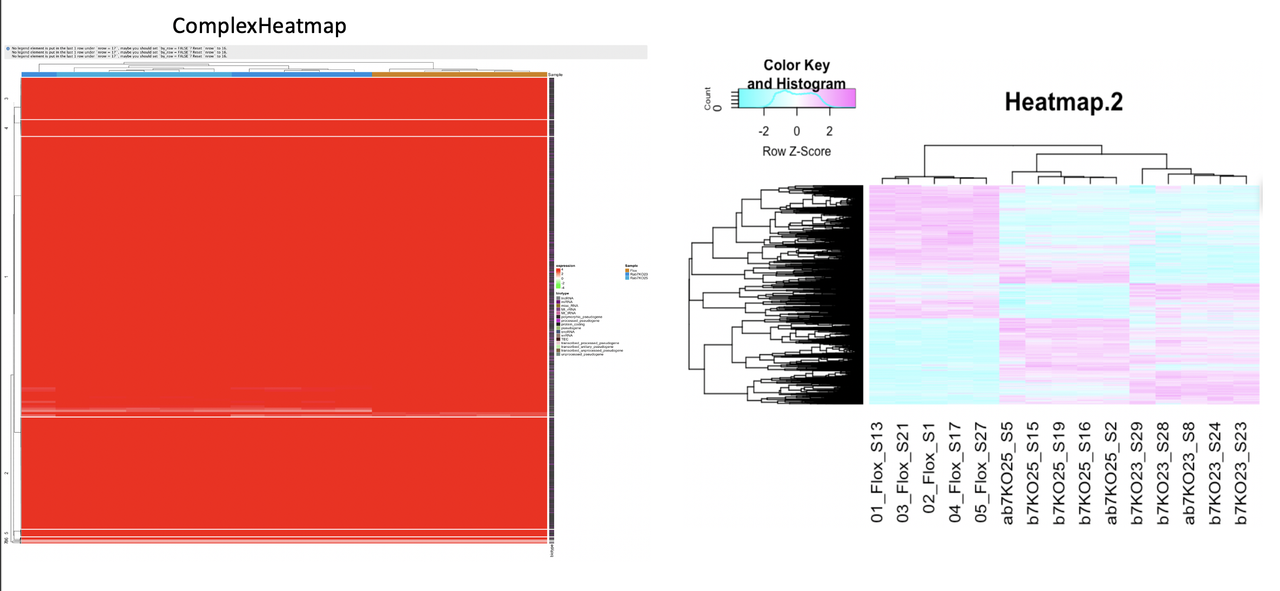
Do I somehow need to scale the data before plotting it?
Thanks for any advice.

thanks, I figure this was my problem.