Clarification of what DESeq2::estimateSizeFactors controlGenes does and when it should *not* be used
1
1
Entering edit mode
kalavattam ▴ 10
@kalavattam-21708
Last seen 9 months ago
United States

Hi,

I want to clarify what is going on under the hood when a user runs DESeq2::estimateSizeFactors() with the controlGenes argument. So, if my understanding is correct, all the steps of size-factor estimation take place, except they are applied only to the genes assigned to controlGenes (except for the final step, which is to apply the calculated size factor to all sample-wise genes) rather than the default of all genes supplied to DESeq2::estimateSizeFactors()—is that right?

A related follow up question: Are there any circumstances in which a user that has spike-in controlGenes for their samples would not want to use them?

Thanks,
Kris

DESeq2 SpikeIn Normalization DifferentialExpression • 1.7k views
ADD COMMENT
2
Entering edit mode
@mikelove
Last seen 14 hours ago
United States

Specifying controlGenes means it estimates the size factors over those rows. But size factors when used later as offsets in GLM or when using counts(..., normalized=TRUE) will apply to all genes.

I'm not sure exactly when you would not want to use spike-ins for normalization or not, that's a bit context specific.

It's a question of: when you want to make comparisons across samples, what do you want to be used a baseline for the purpose of dealing with sequencing depth changes. The measurements are inherently relative, so you need to center the data with size factors.

ADD COMMENT
1
Entering edit mode

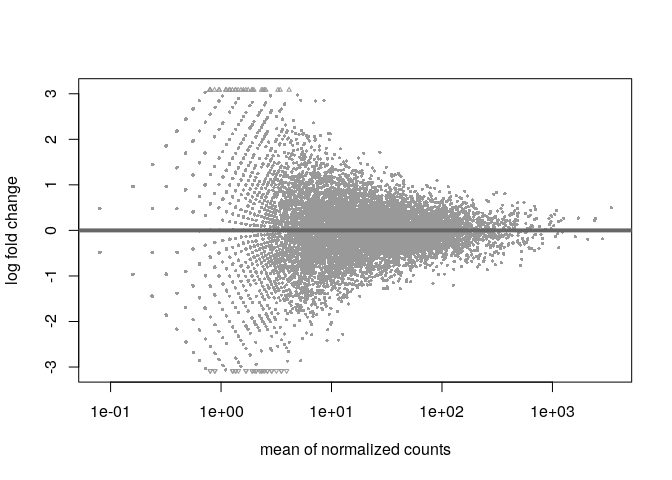
That having said, I recommend to inspect the MA-plots (plotMA()), at best the ones produced right from res <- results(dds); plotMA(res) and see how it looks. The plots usually have an arrowhead-like shape and the "tip" of the arrowhead, so the very righthand part of the plot should be nicely centered at y=0. If that is not the case you would a subset of genes for normalization instead of all. Here is an example of a good and a bad plot (made-up data)

suppressPackageStartupMessages(library(DESeq2))

set.seed(10)
dds <- makeExampleDESeqDataSet(n=10000)

dds <- DESeq(dds)
#> estimating size factors
#> estimating dispersions
#> gene-wise dispersion estimates
#> mean-dispersion relationship
#> final dispersion estimates
#> fitting model and testing
res <- results(dds)

# This looks good
DESeq2::plotMA(res)

# Faking some data to mess up normalization
res$log2FoldChange <- res$log2FoldChange-.5

# This looks poor, normalization is way off
DESeq2::plotMA(res)

The good plot:
enter image description here

The bad plot:
enter image description here

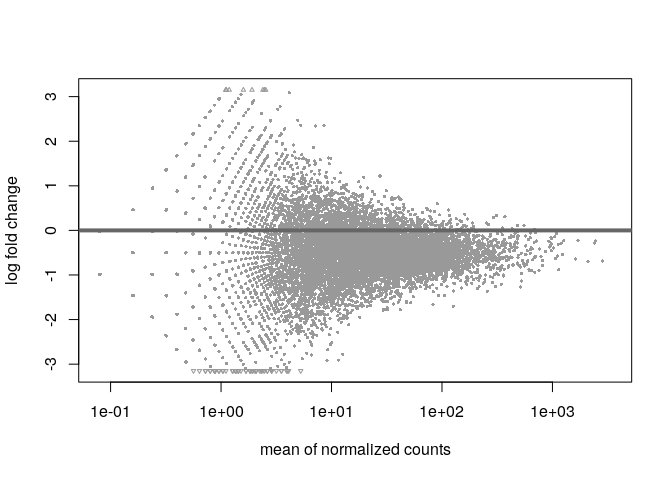
If you get a plot like the second one you can try to use different sets of genes to improve the normalization. If the spikes do not work, then try those genes with overall large baseMeans (like top 10% of genes based on baseMean) to focus on those that are likely stable and not DE.

ADD REPLY

Login before adding your answer.

Traffic: 544 users visited in the last hour
Help About
FAQ
Access RSS
API
Stats

Use of this site constitutes acceptance of our User Agreement and Privacy Policy.

Powered by the version 2.3.6