Choosing the right lower limit for emptyDrops
1
0
Entering edit mode
@fc71d99c
Last seen 6 months ago
United Kingdom

Hi everyone,

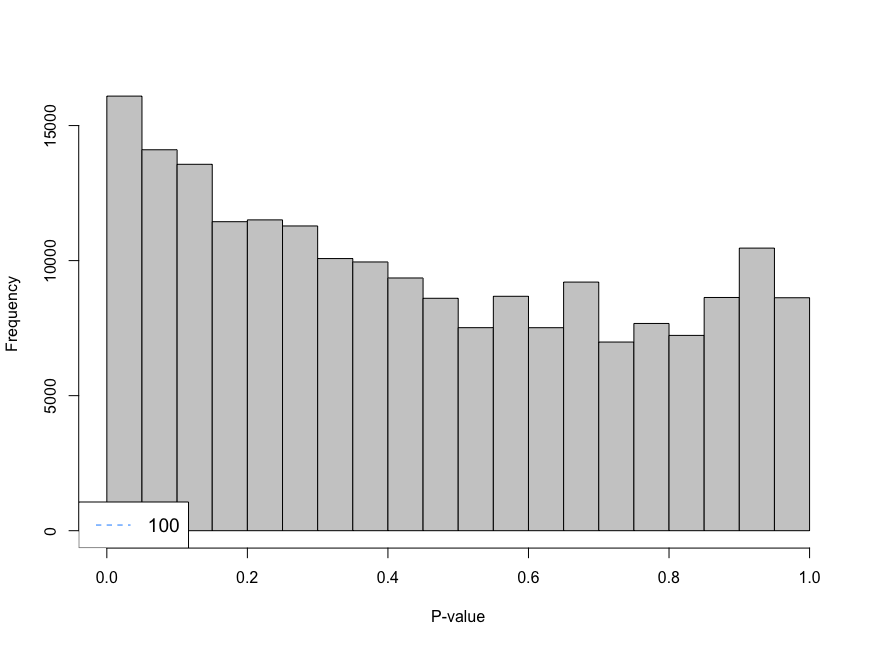
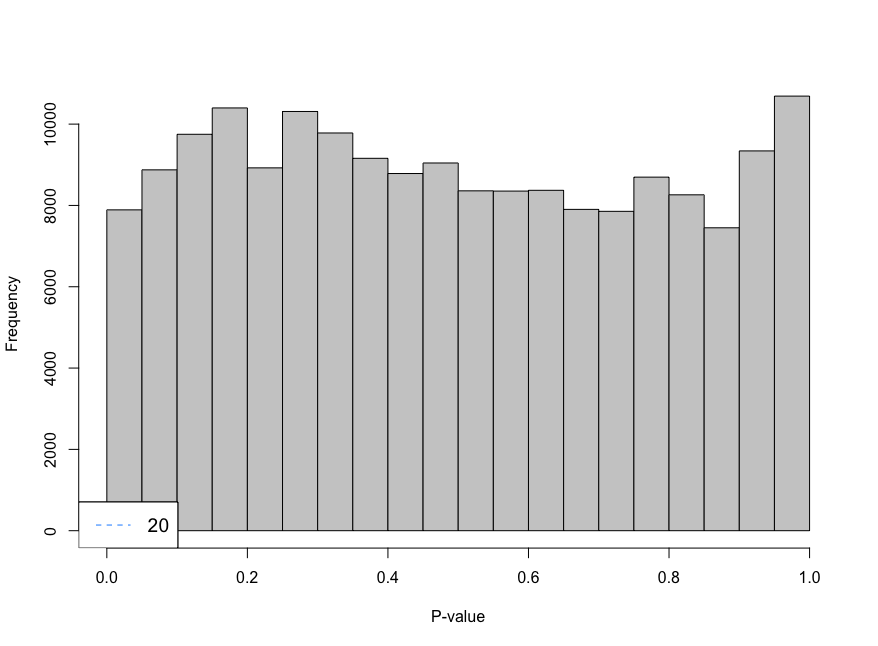
I am trying to analyse single cell data using CellRanger unfiltered data and I am using emptyDrops to remove droplets that contain ambient RNA. When using the parameter lower I am using 100 as the limit, however, the histogram shows large peaks near cero. I have decreased the parameter lower from 100 to 20 and look at the histogram. The histogram gives an "even" distribution at 20. I am not sure if that is a too low value to use as limit.

-Is decreasing the limit a sensible choice? -Not sure, if I fully understand the effect of setting a limit for this function -Is there any function to measure the lower limit?

Code should be placed in three backticks as shown below


limit <- 20
e.out_sample_1 <- emptyDrops(counts(sample_1), lower=limit, test.ambient=TRUE, BPPARAM = bp.params)
hist(e.out_sample_1$PValue[e.out_sample_1$Total <= limit & e.out_sample_1$Total > 0],
     xlab="P-value", main="", col="grey80") 
legend("bottomleft", legend=limit, 
       col="dodgerblue", lty=2, cex=1.2)

Limit at 100 Limit at 20

sessionInfo( )
R version 4.2.2 (2022-10-31)
Platform: aarch64-apple-darwin20 (64-bit)
Running under: macOS Ventura 13.3.1

Matrix products: default
LAPACK: /Library/Frameworks/R.framework/Versions/4.2-arm64/Resources/lib/libRlapack.dylib

locale:
[1] en_US.UTF-8/en_US.UTF-8/en_US.UTF-8/C/en_US.UTF-8/en_US.UTF-8

attached base packages:
[1] grid      stats4    stats     graphics  grDevices utils     datasets  methods   base     

other attached packages:
 [1] lubridate_1.9.2             forcats_1.0.0               stringr_1.5.0              
 [4] dplyr_1.1.2                 purrr_1.0.1                 readr_2.1.4                
 [7] tidyr_1.3.0                 tibble_3.2.1                tidyverse_2.0.0            
[10] UpSetR_1.4.0                cowplot_1.1.1               BiocParallel_1.32.6        
[13] scater_1.26.1               ggplot2_3.4.2               scuttle_1.8.4              
[16] DropletUtils_1.18.1         SingleCellExperiment_1.20.1 SummarizedExperiment_1.28.0
[19] Biobase_2.58.0              GenomicRanges_1.50.2        GenomeInfoDb_1.34.9        
[22] IRanges_2.32.0              S4Vectors_0.36.2            BiocGenerics_0.44.0        
[25] MatrixGenerics_1.10.0       matrixStats_0.63.0         

loaded via a namespace (and not attached):
 [1] bitops_1.0-7              bit64_4.0.5               httr_1.4.5               
 [4] tools_4.2.2               utf8_1.2.3                R6_2.5.1                 
 [7] irlba_2.3.5.1             HDF5Array_1.26.0          vipor_0.4.5              
[10] DBI_1.1.3                 colorspace_2.1-0          rhdf5filters_1.10.1      
[13] withr_2.5.0               tidyselect_1.2.0          gridExtra_2.3            
[16] bit_4.0.5                 compiler_4.2.2            cli_3.6.1                
[19] BiocNeighbors_1.16.0      DelayedArray_0.24.0       scales_1.2.1             
[22] R.utils_2.12.2            XVector_0.38.0            pkgconfig_2.0.3          
[25] sparseMatrixStats_1.10.0  fastmap_1.1.1             limma_3.54.2             
[28] rlang_1.1.0               rstudioapi_0.14           RSQLite_2.3.1            
[31] DelayedMatrixStats_1.20.0 generics_0.1.3            R.oo_1.25.0              
[34] RCurl_1.98-1.12           magrittr_2.0.3            BiocSingular_1.14.0      
[37] GenomeInfoDbData_1.2.9    Matrix_1.5-4              Rcpp_1.0.10              
[40] ggbeeswarm_0.7.1          munsell_0.5.0             Rhdf5lib_1.20.0          
[43] fansi_1.0.4               viridis_0.6.2             lifecycle_1.0.3          
[46] R.methodsS3_1.8.2         stringi_1.7.12            edgeR_3.40.2             
[49] zlibbioc_1.44.0           rhdf5_2.42.1              plyr_1.8.8               
[52] blob_1.2.4                parallel_4.2.2            ggrepel_0.9.3            
[55] dqrng_0.3.0               crayon_1.5.2              lattice_0.21-8           
[58] Biostrings_2.66.0         beachmat_2.14.2           hms_1.1.3                
[61] KEGGREST_1.38.0           locfit_1.5-9.7            metapod_1.6.0            
[64] pillar_1.9.0              igraph_1.4.2              codetools_0.2-19         
[67] ScaledMatrix_1.6.0        glue_1.6.2                scran_1.26.2             
[70] remotes_2.4.2             BiocManager_1.30.20       png_0.1-8                
[73] vctrs_0.6.2               tzdb_0.3.0                gtable_0.3.3             
[76] cachem_1.0.7              rsvd_1.0.5                viridisLite_0.4.1        
[79] AnnotationDbi_1.60.2      beeswarm_0.4.0            memoise_2.0.1            
[82] cluster_2.1.4             statmod_1.5.0             bluster_1.8.0            
[85] timechange_0.2.0

Thanks!!

SingleCell emptyDrops 10X • 658 views
ADD COMMENT
0
Entering edit mode
Peter Hickey ▴ 740
@petehaitch
Last seen 8 days ago
WEHI, Melbourne, Australia

If you haven't already, the 'Droplet processing' chapter of OSCA gives some guidance on running emptyDrops() including the choice of lower and is worth reading. In particular,

emptyDrops() assumes that barcodes with low total UMI counts are empty droplets [i.e. barcodes with total UMI count at or below lower are assumed to be empty droplets]. Thus, the null hypothesis should be true for all of these barcodes. We can check whether the hypothesis testing procedure holds its size by examining the distribution of p-values for low-total barcodes with test.ambient=TRUE. Ideally, the distribution should be close to uniform ... Large peaks near zero indicate that barcodes with total counts below lower are not all ambient in origin. This can be resolved by decreasing lower further to ensure that barcodes corresponding to droplets with very small cells are not used to estimate the ambient profile.

Your diagnostic plots show that using a smaller lower is reducing the peak of near zero p-values, so it would seem sensible to use a lower < 100.

You might also compare which barcodes are being identified as 'non-empty' when using lower = 100 to lower = 20 (or other values) to see how much affect it's actually having on the final calls. Those droplets identified as 'non-empty' only when using a smaller value of lower will generally have small total UMI counts and so may comprise low quality cells or specific cell types with less total RNA or something else. You'd need to do further analysis of those droplets to try to determine this.

Finally, remember that an appropriate choice of lower depends a bit on the sequencing depth of your samples (providing this info may help someone give you further guidance). For 10x libraries sequencing to an average of ~20,000 reads/barcode (i.e. 10x's recommended minimum depth for v3 libraries) I have found lower=100 to generally be satisfactory but I have reduced lower when a library has been shallowly sequenced (after looking at the same diagnostic plots you are using).

ADD COMMENT

Login before adding your answer.

Traffic: 590 users visited in the last hour
Help About
FAQ
Access RSS
API
Stats

Use of this site constitutes acceptance of our User Agreement and Privacy Policy.

Powered by the version 2.3.6