Why was the number of DEG different between DESeq results and count by myself using excel?
1
0
Entering edit mode
sybyun419 • 0
@a674d830
Last seen 8 months ago
South Korea

When I use DESeq code as below

sampleFiles <- grep("counts", list.files(directory),value=T) condition <- c("0W","1W","2W","3W","0W","1W","2W","3W","0W","1W","2W","3W") sampleTable <- data.frame(sampleName = sampleFiles, fileName = sampleFiles, condition = condition) sampleTable$condition <- factor(sampleTable$condition) ddsHTSeq <- DESeqDataSetFromHTSeqCount(sampleTable = sampleTable, directory = directory, design= ~ condition)

dds <- DESeq(ddsHTSeq) resultsNames(dds) res <- results(dds, alpha = 0.05, name = "condition_1W_vs_0W", lfcThreshold =1 )

I got a result like attaced pictureenter image description here

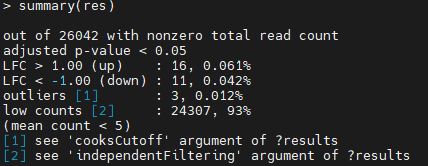
I got a 16 up-regulated gene from DESeq2 result.

However, when I count number of upregulated gene using excel with same threshold (paj<0.05, logfoldchange >1) I got a 211 up-regulated gene.

enter image description here

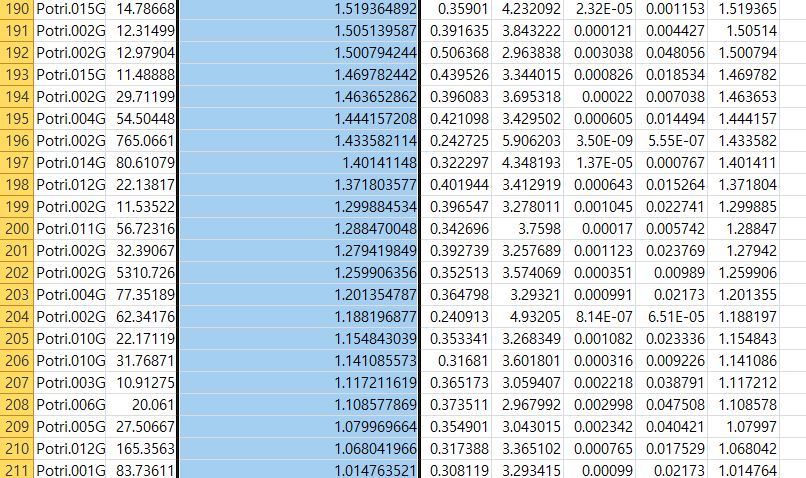
Do you know why the result of deg is different despite I used same thereshold?

RNASeqData DEGseq • 496 views
ADD COMMENT
0
Entering edit mode
ATpoint ★ 4.0k
@atpoint-13662
Last seen 2 days ago
Germany

Please understand that this forum is meant for technical help with the packages. Excel is none of it, and figuring out how to do proper filtering and manipulation in it is off-topic here. The answer can be that either your filtering or counting is wrong or that loading the output into Excel does some sort of conversion of numbers that skew the result, but digging that out is on you.

ADD COMMENT

Login before adding your answer.

Traffic: 530 users visited in the last hour
Help About
FAQ
Access RSS
API
Stats

Use of this site constitutes acceptance of our User Agreement and Privacy Policy.

Powered by the version 2.3.6