DESeq2 Normalization with 4 Groups
2
0
Entering edit mode
@5c4f0cfb
Last seen 5 months ago
United States

Hello All!

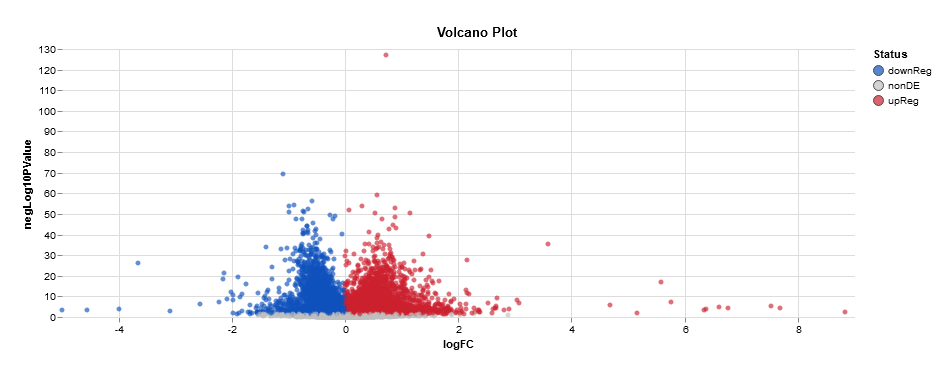
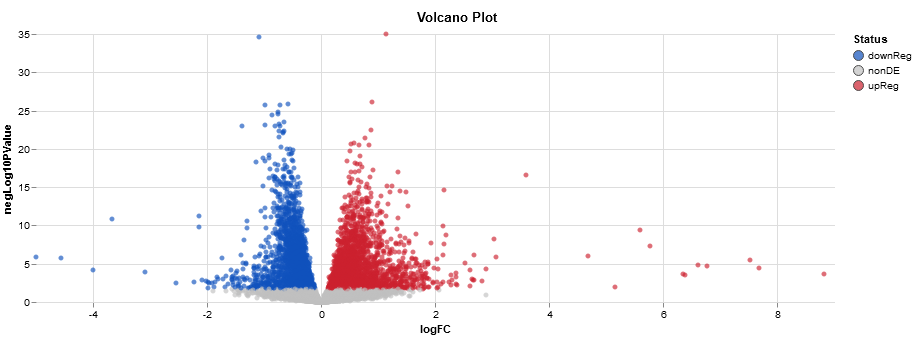
I am running DESeq2 on my RNA Seq dataset. I have four groups in my treatment with 8 replicates and about 14,500 rows (genes) after using keep (removing low copy numbers) and removing NA. I also used level so that my Control is the reference. So I have my Control (c), Treatment 1 (T1), Treatment 2 (T2), and Treatment (T3). I want to compare DE in T1 vs T2, T2 vs T3, T2 vs T1, and T1 vs T3. I was thinking of going with LRT, because I read that you would use that if you have more than 3 or 2 in your group. After normalizing I decided to do results and use contrast to compare T2 vs T3. My results look weird and it is making question whether I should do LRT or Wald test for normalization. Below are my MA plots for LRT and Wald, my histogram to look at frequency, and volcano plots to look at up and down regulated genes. Any input is greatly appreciated as this is my first time doing RNA Seq and I am the only bioinformatician in my group so I have no one to turn to, to ask questions.

Question I need answered: Is LRT correct or should I go Wald with lfcshrink? or should I do LRT with lfcshrink?

Links I have read (there are more):

hbctraining DGE_workshop

Bioconductor vignettes Documentation

DGE Work shop

Another Vignette Doc

Bioconductor Question

Bioconductor Question 2

NCBI Power analysis for RNA-Seq differential expression studies

Below is snippets of my code:


ddsLRT <- DESeq(dds, test = "LRT", fitType = "parametric", reduced = ~1)
ddsWald <- DESeq(dds, test = "Wald", fitType = "parametric")

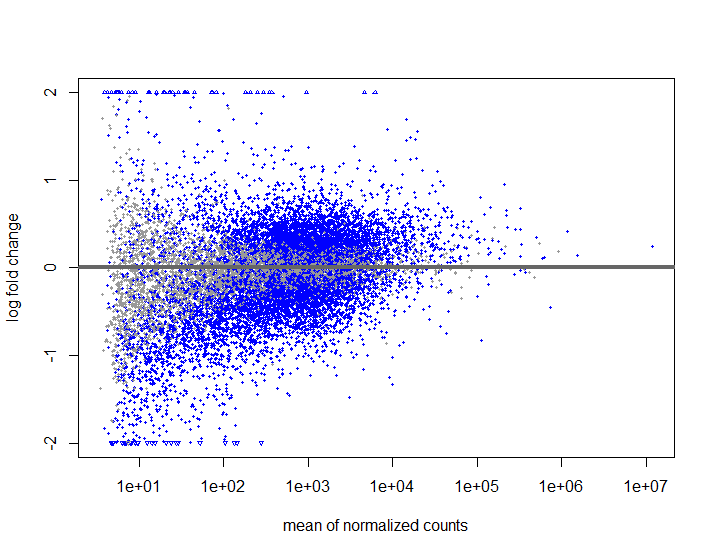
T2VT3Res <- results(ddsLRT, contrast = c("treatment","T2","T3")) #Tried to put alpha = 0.05, but the graph looked the same.
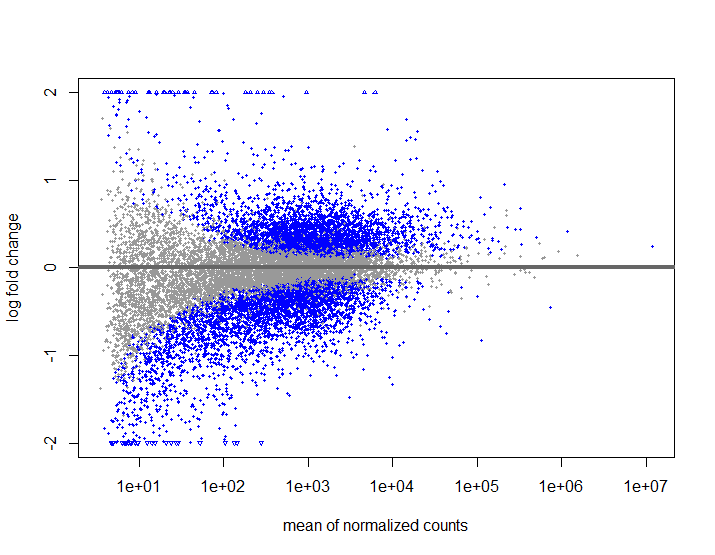
T2VT3ResW <- results(ddsWald, contrast = c("treatment","T2","T3"))

plotMA(T2VT3Res , ylim=c(-2,2))
plotMA(T2VT3ResW , ylim=c(-2,2))

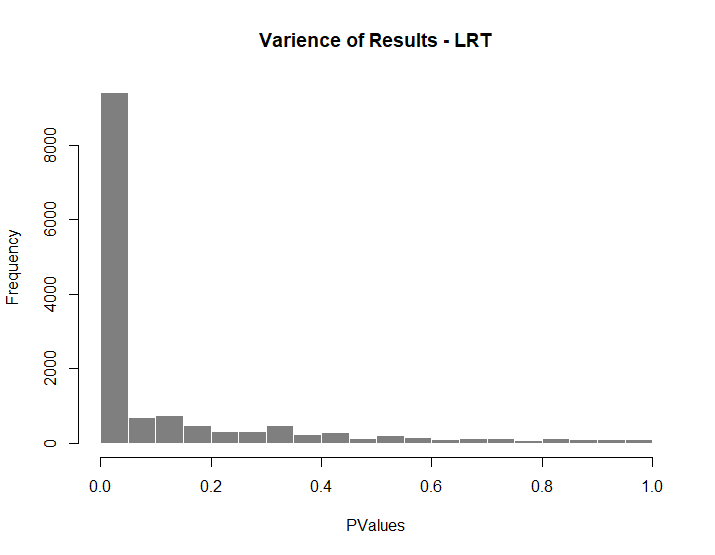
hist(T2VT3Res $pvalue[T2VT3Res $baseMean], breaks = 0:20/20,col = "grey50", border = "white", main = "Varience of Results - LRT", xlab = "PValues")
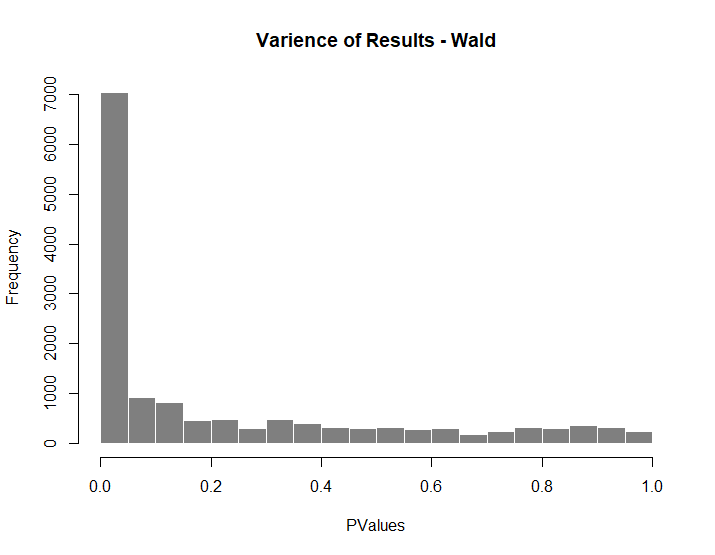
hist(T2VT3ResW $pvalue[T2VT3ResW $baseMean], breaks = 0:20/20,col = "grey50", border = "white", main = "Varience of Results - Wald", xlab = "PValues")

T2 vs T3 LRT T2 vs T3 Wald Hist LRT Hist Wald Volcano LRT Volcano Wald

Normalization RNASeq DESeq2 • 816 views
0
Entering edit mode

Does one of those tutorials show that you use contrasts with LRT? I didn't think it worked that way; LRT just tells you if things are different among all your groups, I don't think it captures the patterns of how this group or that group behaves for specific genes.

ADD REPLY
0
Entering edit mode

I used contrast in the results function not in LRT. I used it so I could do pairwise comparison.

ADD REPLY
0
Entering edit mode
ATpoint ★ 4.0k
@atpoint-13662
Last seen 19 hours ago
Germany

Generally, if you want to do discrete pairwise comparisons like A vs B, A vs C, B vs C and so on, you would use the Wald test as this directly tests for differences in the fold change, which is intuituve to interpret (at least to me), and you often want to report these effect sizes downstream. The LRT (again to me) makes most sense if you have many groups and your question was whether there is any difference or some sort of trendwise pattern between any of the groups rather than a direct pairwise comparison. Please see the vignette on contrasts, and maybe on lfcShrink to test against a certain fold change since you seem to have a lot of DEGs, and may want to prioritize a bit.

ADD COMMENT
0
Entering edit mode

Thank you for your response I went with Wald and lfcShrink for the results. My PI wants me to do pairwise compairsons.

ADD REPLY
0
Entering edit mode
@james-w-macdonald-5106
Last seen 14 hours ago
United States

You don't use either the Wald or LRT for normalization. They are ways to test hypotheses. The LRT tests the model fit of the full and reduced model, and doesn't tell you anything about the individual contrasts. If you care to know if one group is different from another you have to use the Wald test. As an example,

> z <- makeExampleDESeqDataSet()
## add more conditions
> z$condition <- factor(rep(LETTERS[1:4], each = 3))
## LRT and Wald
> zlrt <- DESeq(z, "LRT", reduced = ~1)
> zwald <- DESeq(z)
> tst <- lapply(resultsNames(zlrt)[-1], function(x) results(zlrt, name = x)$pvalue)
## p-values for each contrast are identical when using LRT
> all.equal(tst[[1]], tst[[2]])
[1] TRUE
> all.equal(tst[[1]], tst[[3]])
[1] TRUE
## but not for the Wald test
> tst2 <- lapply(resultsNames(zlrt)[-1], function(x) results(zwald, name = x)$pvalue)
> all.equal(tst2[[1]], tst2[[2]])
[1] "Mean relative difference: 0.5960772"
> all.equal(tst2[[1]], tst2[[3]])
[1] "Mean relative difference: 0.5886132

And using the LRT or Wald provides identical log2FoldChange values.

> sapply(resultsNames(zlrt)[-1], function(x) all.equal(results(zlrt, name = x)$log2FoldChange, results(zwald, name = x)$log2FoldChange)) 
condition_B_vs_A condition_C_vs_A condition_D_vs_A 
            TRUE             TRUE             TRUE

And using lfcShrink doesn't change the results, except providing shrunken log2FoldChanges for plotting.

> sapply(resultsNames(zlrt)[-1], function(x) all.equal(lfcShrink(zwald, coef = x)$pvalue, results(zwald, name = x)$pvalue)) 
condition_B_vs_A condition_C_vs_A condition_D_vs_A 
            TRUE             TRUE             TRUE

You cannot improve your results by changing the test you are using, because the two tests are not the same. And you cannot fix your results by using lfcShrink, because that is meant for visualization and ranking, not statistical testing. From the vignette:

Log fold change shrinkage for visualization and ranking Shrinkage of effect size (LFC estimates) is useful for visualization and ranking of genes. To shrink the LFC, we pass the dds object to the function lfcShrink. Below we specify to use the apeglm method >for effect size shrinkage (Zhu, Ibrahim, and Love 2018), which improves on the previous estimator.

0
Entering edit mode

I realized that today that LRT and Wald do not do normalization. DESeq automatically does normalization on the data. Thank you for your response I went with Wald and lfcShrink for the results.

ADD REPLY

Login before adding your answer.

Traffic: 599 users visited in the last hour
Help About
FAQ
Access RSS
API
Stats

Use of this site constitutes acceptance of our User Agreement and Privacy Policy.

Powered by the version 2.3.6