Entering edit mode

Hello,
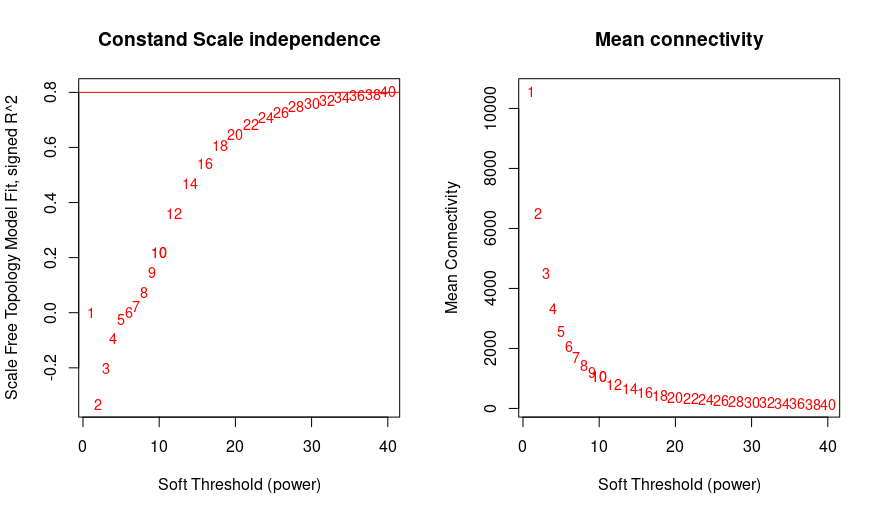
As a newbie i was trying to do WGCNA for my transcriptomics data. I used vst normalization and tried to choose soft power. Even in high numbers i couldnt reach 0.8 treshold. Is there any suggestions for overcome this problem ?
# include your problematic code here with any corresponding output
# please also include the results of running the following in an R session
dds <- DESeqDataSetFromMatrix(
  countData = raw_counts, # Our prepped data frame with counts
  colData = coldata, # Data frame with annotation for our samples
  design = ~condition # Here we are not specifying a model
)


dds_norm <- vst(dds)


# Retrieve the normalized data from the `DESeqDataSet`
normalized_counts <- assay(dds_norm) %>%
  t() # Transpose this data
datExpr = normalized_counts


## Run this to check if there are gene outliers
gsg = goodSamplesGenes(datExpr, verbose = 3)
gsg$allOK


if (!gsg$allOK)
{if (sum(!gsg$goodGenes)>0)
  printFlush(paste("Removing genes:", paste(names(datExpr)[!gsg$goodGenes], collapse= ", ")));
  if (sum(!gsg$goodSamples)>0)
    printFlush(paste("Removing samples:", paste(rownames(datExpr)[!gsg$goodSamples], collapse=", ")))
  datExpr= datExpr[gsg$goodSamples, gsg$goodGenes]
}
powers = c(c(1:10), seq(from =10, to=40, by=2)) #choosing a set of soft-thresholding powers
sft = pickSoftThreshold(datExpr, powerVector=powers, verbose =5, networkType="signed") #call network topology analysis function
par(mfrow= c(1,2))
cex1=0.9
plot(sft$fitIndices[,1], -sign(sft$fitIndices[,3])*sft$fitIndices[,2], xlab= "Soft Threshold (power)", ylab="Scale Free Topology Model Fit, signed R^2", type= "n", main= paste("Constand Scale independence"))
text(sft$fitIndices[,1], -sign(sft$fitIndices[,3])*sft$fitIndices[,2], labels=powers, cex=cex1, col="red")
abline(h=0.80, col="red")
plot(sft$fitIndices[,1], sft$fitIndices[,5], xlab= "Soft Threshold (power)", ylab="Mean Connectivity", type="n", main = paste("Mean connectivity"))
text(sft$fitIndices[,1], sft$fitIndices[,5], labels=powers, cex=cex1, col="red")
sessionInfo( )
WGCNA is not a Bioconductor package. Suggest you ask over at biostars.org which is more suited for general bioinformatics guidance.