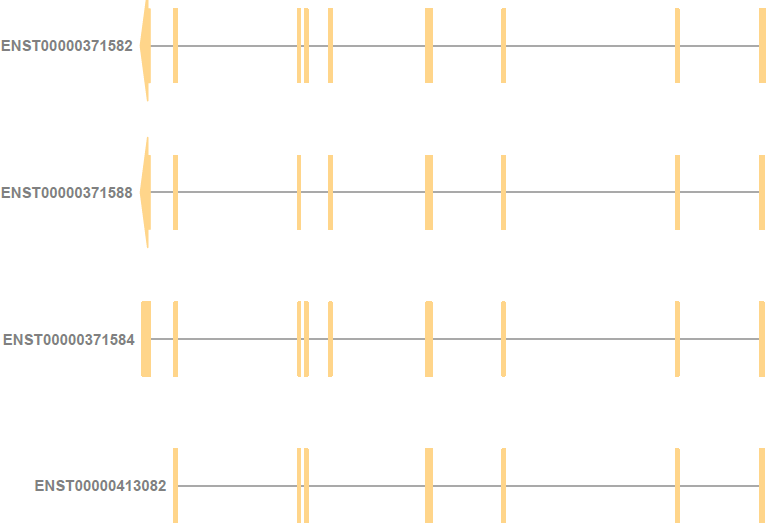
While visualizing the gene along with its transcripts, I found that different transcripts started from different genomic coordinates because of the difference in their exons.
For example, for the gene ENSG00000000419 (DPM1), ENST00000413082 (DPM1-204) starts from the right of the other three protein-coding transcripts. As a result, its annotation is also slightly to the right of the other three transcripts.
Without manual intervention, how can I ensure that the annotation for the transcript ENST00000413082 is also along with the other three transcript annotations in this plot? Is there any function argument I can use?
Thanks!
sessionInfo( ) -
R version 4.0.1 (2020-06-06) Platform: x86_64-w64-mingw32/x64 (64-bit) Running under: Windows 10 x64 (build 19041)
Matrix products: default
locale: 1 LC_COLLATE=English_United States.1252 LC_CTYPE=English_United States.1252 LC_MONETARY=English_United States.1252 [4] LC_NUMERIC=C LC_TIME=English_United States.1252
attached base packages: 1 grid stats4 parallel stats graphics grDevices utils datasets methods base
other attached packages:
1 ensembldb_2.12.1 AnnotationFilter_1.12.0 GenomicFeatures_1.40.1 AnnotationDbi_1.50.3
[5] Biobase_2.48.0 Gviz_1.32.0 GenomicRanges_1.40.0 GenomeInfoDb_1.24.2
[9] IRanges_2.22.2 S4Vectors_0.26.1 AnnotationHub_2.20.2 BiocFileCache_1.12.1
[13] dbplyr_1.4.4 BiocGenerics_0.34.0
loaded via a namespace (and not attached):
1 ProtGenerics_1.20.0 bitops_1.0-6 matrixStats_0.56.0
[4] bit64_4.0.5 RColorBrewer_1.1-2 progress_1.2.2
[7] httr_1.4.2 backports_1.1.7 tools_4.0.1
[10] R6_2.4.1 rpart_4.1-15 lazyeval_0.2.2
[13] Hmisc_4.4-1 DBI_1.1.0 colorspace_1.4-1
[16] nnet_7.3-14 gridExtra_2.3 tidyselect_1.1.0
[19] prettyunits_1.1.1 bit_4.0.4 curl_4.3
[22] compiler_4.0.1 htmlTable_2.1.0 xml2_1.3.2
[25] DelayedArray_0.14.1 rtracklayer_1.48.0 checkmate_2.0.0
[28] scales_1.1.1 askpass_1.1 rappdirs_0.3.1
[31] stringr_1.4.0 digest_0.6.25 Rsamtools_2.4.0
[34] foreign_0.8-80 XVector_0.28.0 dichromat_2.0-0
[37] base64enc_0.1-3 jpeg_0.1-8.1 pkgconfig_2.0.3
[40] htmltools_0.5.0 fastmap_1.0.1 BSgenome_1.56.0
[43] htmlwidgets_1.5.1 rlang_0.4.7 rstudioapi_0.11
[46] RSQLite_2.2.1 shiny_1.5.0 generics_0.0.2
[49] BiocParallel_1.22.0 dplyr_1.0.0 VariantAnnotation_1.34.0
[52] RCurl_1.98-1.2 magrittr_1.5 GenomeInfoDbData_1.2.3
[55] Formula_1.2-4 Matrix_1.2-18 Rcpp_1.0.5
[58] munsell_0.5.0 lifecycle_0.2.0 stringi_1.4.6
[61] yaml_2.2.1 SummarizedExperiment_1.18.2 zlibbioc_1.34.0
[64] blob_1.2.1 promises_1.1.1 crayon_1.3.4
[67] lattice_0.20-41 Biostrings_2.56.0 splines_4.0.1
[70] hms_0.5.3 knitr_1.29 pillar_1.4.6
[73] biomaRt_2.44.4 XML_3.99-0.5 glue_1.4.1
[76] BiocVersion_3.11.1 biovizBase_1.36.0 latticeExtra_0.6-29
[79] data.table_1.12.8 BiocManager_1.30.10 vctrs_0.3.2
[82] png_0.1-7 httpuv_1.5.4 gtable_0.3.0
[85] openssl_1.4.2 purrr_0.3.4 assertthat_0.2.1
[88] ggplot2_3.3.2 xfun_0.15 mime_0.9
[91] xtable_1.8-4 later_1.1.0.1 survival_3.1-12
[94] tibble_3.0.3 GenomicAlignments_1.24.0 tinytex_0.25
[97] memoise_1.1.0 cluster_2.1.0 ellipsis_0.3.1
[100] interactiveDisplayBase_1.26.3


Hello Robert,
Thank you for your input. I also could not find any way to achieve what I wanted without any manual intervention.
Nevertheless, please do let me know if you come across any way to do this without any manual intervention.
Thanks!