
Hello Bioconductor community,
I'm trying to analyze miRNASeq data of TCGA melanoma (SKCM) samples. This is a prototype analysis in which I picked hsa-mir-155 and looked at how its expression is correlated with survival. My end goal is expanding this analysis to other cancer types also focusing on other miRNAs.
I performed my analyses with two of the popular packages in R (RTCGA and TCGAbiolinks) and obtained quite different results. RTCGA package features data from 2015-11-01. I used harmonized data when I was trying TCGAbiolinks. I'm trying to make sense of what might be causing the different results. Any help is appreciated. For comparison purposes, I'm attaching some figures and my codes as well.
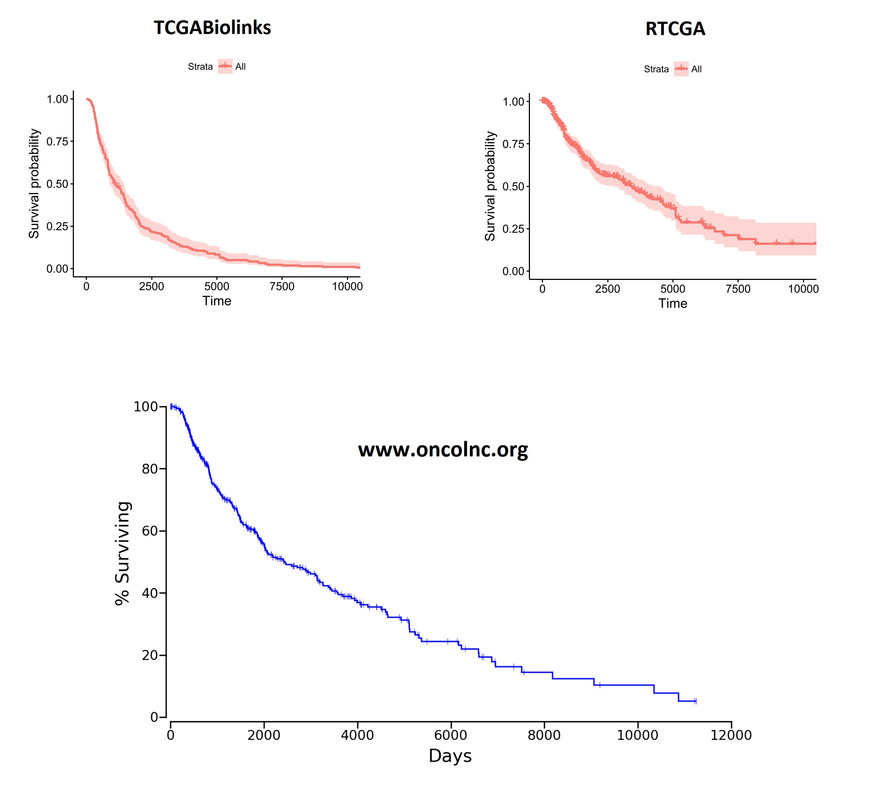
![Kaplan-Meier curves][1] Overall Kaplan-Meier curves look quite different. These plots were generated on the whole cohort (unsegregated for any parameter). I'm including the plot from oncoLNC.org database as well for comparison purposes. RTCGA looks more like the oncoLNC curve.
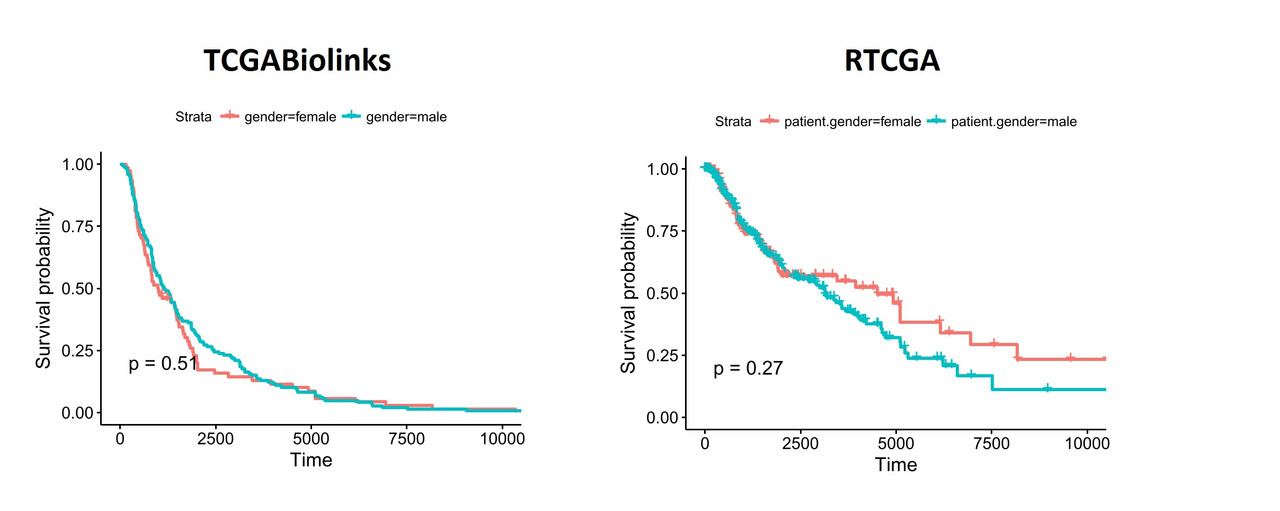
You can see similar differences when the data is segregated based on patient.gender:
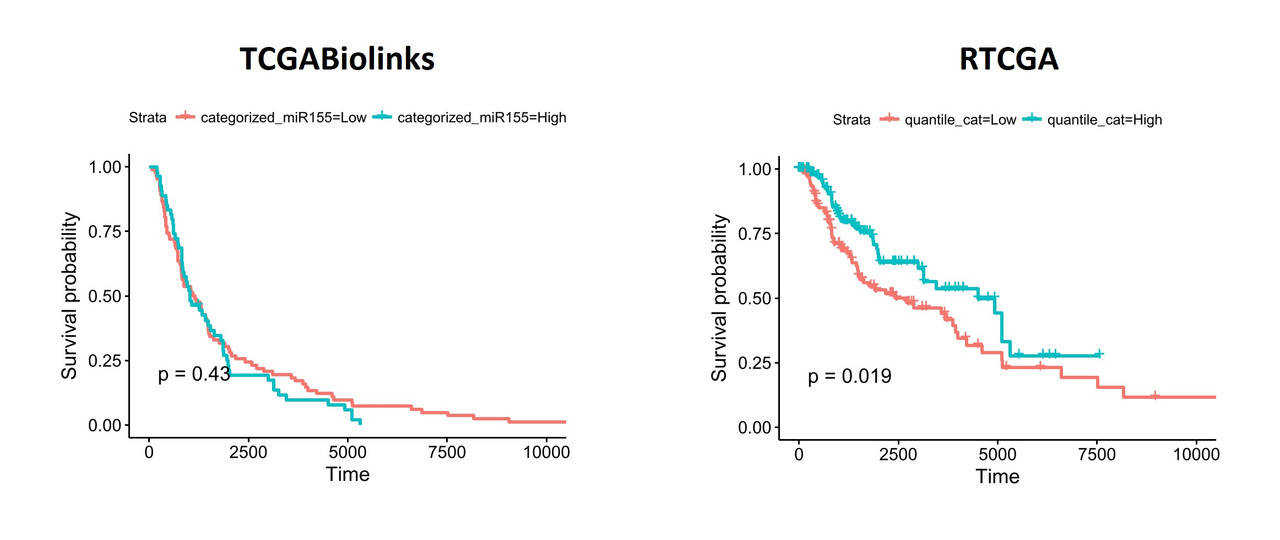
When I segregate patients based on the expression of hsa-mir-155 (top and bottom thirds), the differences become more obvious:
To understand what might be different in the datasets I exported the data from both packages and performed a comparison. Linked excel file shows the comparisons including clinical details (days_to_death and days_to_last_follow_up) and gene expression values of hsa-mir-155 (both read_count and reads_per_million_miRNA. I noticed that there are considerable differences between two datasets. I'm pretty sure, the way I organized the data is ok and I don't think the differences are due a mistake in data manipulation in R.
The code I used for analyses can be found at
Please let me know why you think there is a discrepancy here. I'm pretty new to this type of analyses and hopefully, I didn't miss something silly.
Thank you very much in advance for your insights,
Atakan

Hi Levi,
Thank you very much for your response! This package looks pretty exciting and I see that you are one of the authors. I'm looking forward to trying this. Can you please let me know a bit about the data hosted within the package? Is it pulling out the most recent harmonized data from Firehose? I'm not that familiar with Firehose and I'm not sure if it is constantly maintained/updated to incorporate changes in TCGA data.
Best,
Atakan
Hi Atakan,
The last TCGA Firehose run date was 20160128, and there are no new cases or survival follow-up after that date. It’s that snapshot that RTCGAToolbox, TCGABiolinks, and curatedTCGAData can provide you with, and it’s the most recent data available from Firehose. curatedTCGAData does something extra in merging levels 1-3 clinical pathological and specimen data, plus subtypes extracted from supplemental tables of primary publications, within the colData of the MultiAssayExperiment.
There is ongoing QC work and processing through a hg38 pipeline at the Genomic Data Commons, which you would have to access through the GenomicDataCommons package. You can see the kind and frequency of updates they are doing at https://docs.gdc.cancer.gov/Data/Release_Notes/Data_Release_Notes/.
Note there are differences in the sequence analysis pipeline used by GDC than was used by Firehose, in particular, default GDC data is based on hg38 coordinates whereas Firehose (and “legacy” data from GDC) are based on hg19, see:
https://confluence.broadinstitute.org/m/view-rendered-page.action?pageId=31232809
Sincerely,
Levi
Dear @Levi Waldron. Please don't missname RTCGA with RTCGAToolbox. Those are two various packages. Best.
Indeed Marcin, my apologies! That explains how the asker was getting 2015-11-01 release data; they should be using your "20160128" set of data packages.
20160128 are only on GitHub. I had no power and energy to transfer them to the Bioconductor ready format https://github.com/RTCGA