Small RNA-seq Analysis DESEQ2 : Unexpected Significance
1
0
Entering edit mode
samer ▴ 10
@e8e266ba
Last seen 4 months ago
France

Hello everyone,

I've been working extensively with a small RNA-seq dataset comprising 47 samples, each associated with a specific date and categorized into 'ON' or 'OFF' conditions, with three replicates per condition (except for one condition with two replicates only). This dataset encompasses the counts of 77,000 small RNA molecules detected on our reference genome using short stack.

I've conducted my DESeq2 analysis using the following code setup:

dds <- DESeqDataSetFromMatrix(countData = data, colData = metadata, design = ~ lab) dds <- DESeq(dds, betaPrior = TRUE)

Utilizing the results() function, I extracted differential expression results for each 'date + condition (lab)' combinations:

contrast <- c("lab", paste0(day, "ON"), paste0(day, "OFF")) res <- results(dds, contrast = contrast) result_data <- as.data.frame(res)

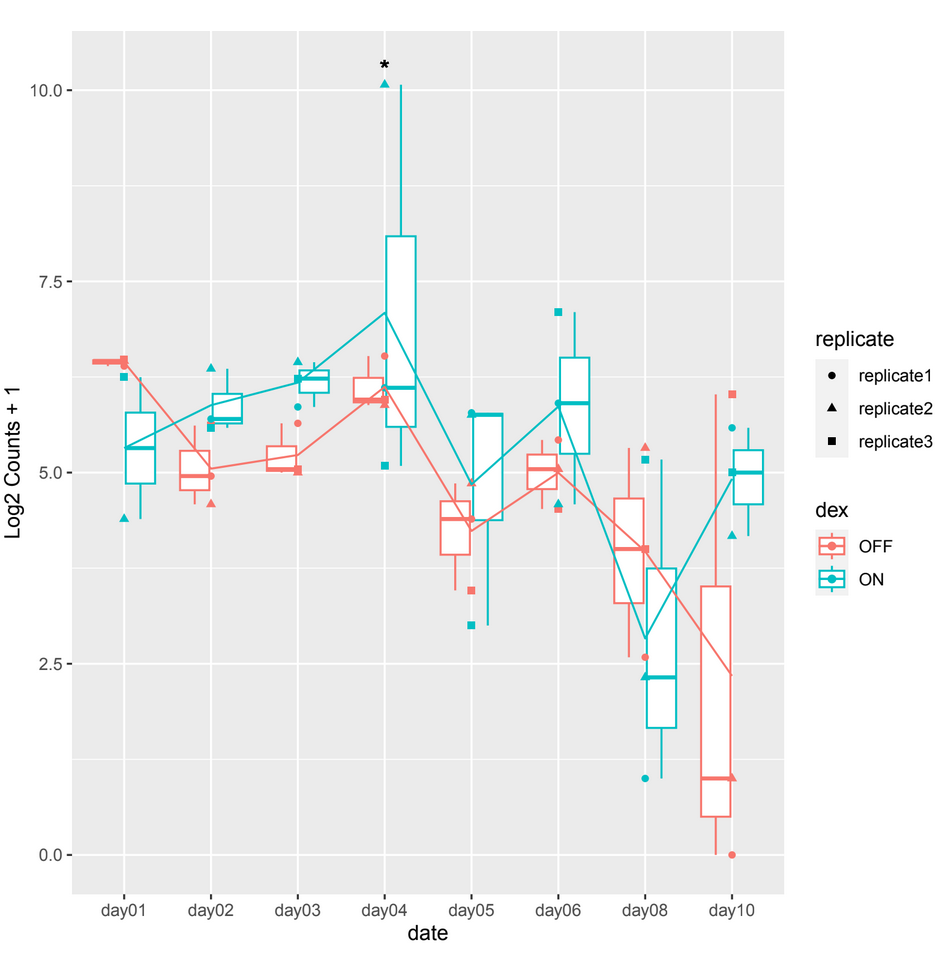
However, when examining the count plots, I've observed a frequent occurrence of significant adjusted p-values between conditions particularly on date 4 when it shouldn't be, this occurrence seems unexpected (example 1).

example 1 :

enter image description here

enter image description here

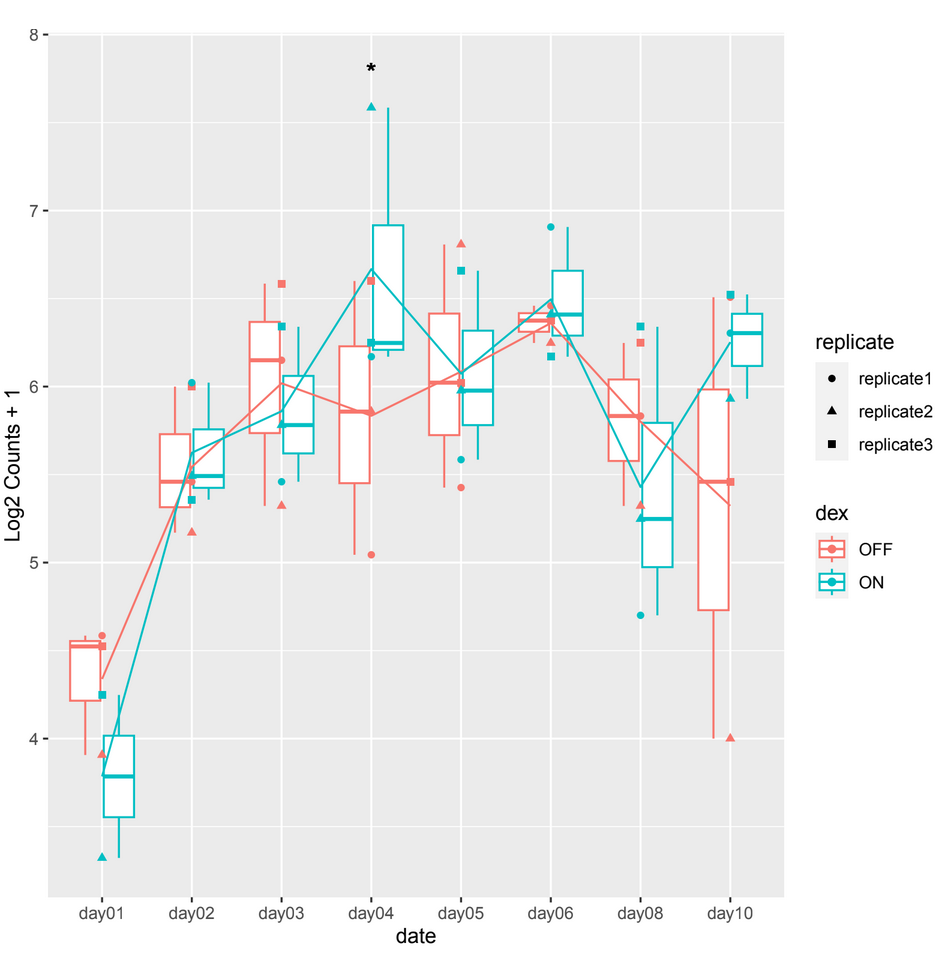
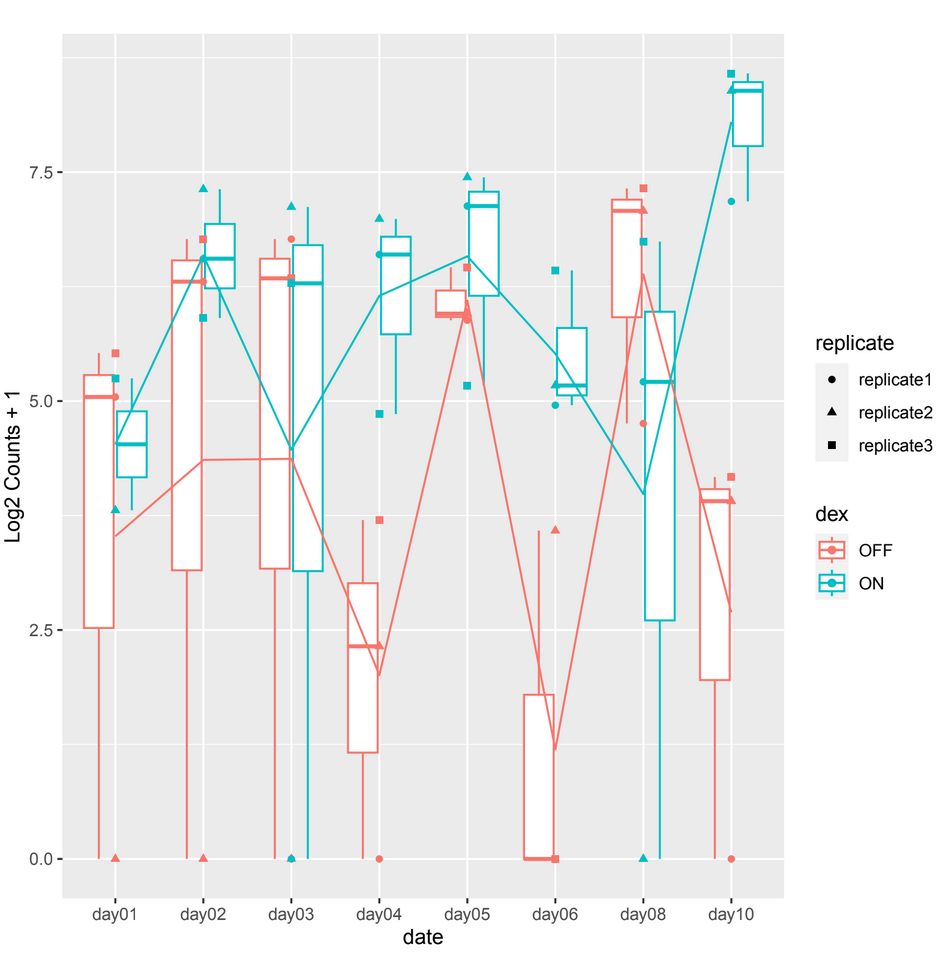
and sometimes in other count plots we observe a difference between the counts of the 2 conditions (ON/OFF) where it should be significant but it is not, such as in day10, day06 in example 2.

example 2 :

enter image description here

And considering the size of my dataset where significant disparities are also noticeable among the replicates, I'm concerned about potential biases or confounding factors that might be influencing these results.

Could anyone provide any insights or details regarding the potential source of the problem ?

And is there a recommended alternative approach or additional steps that I should consider when dealing with such a vast dataset in DESeq2 to mitigate potential false discoveries ?

I would greatly appreciate any insights or suggestions !

conditions replicates SmallRNAData DESeq2 • 891 views
ADD COMMENT
0
Entering edit mode

What is Log2 Counts + 1? Please show code for the plots. And please remove the comments and move everything to the toplevel question using the Edit button. It gets messy if you spread the question like that. Right now it's the question and four comments, impossible to keep a comment structure with that.

ADD REPLY
0
Entering edit mode

By applying the log2 transformation to the raw counts of small RNAS AND after adding 1 to each count, the resulting values often approximate a more normal distribution, which can be beneficial for downstream statistical analyses and for plotting.

  p <- ggplot(data = current_cluster, aes(x = date, y = as.numeric(log_count), color = dex )) +
        geom_boxplot() + geom_point(aes(colour = dex, shape = replicate, group = date)) +
        stat_summary(fun.y = mean, geom = 'line', aes(group = dex, colour = dex)) + 
        geom_text(data = filter(current_cluster, significance == "*"), aes(label = "*", x = date, y = max(current_cluster$log_count) + 0.2), size = 5, color = "black") +
        stat_summary(fun = "mean", geom = "line") +
        ylab("Log2 Counts + 1") +
        ggtitle(paste("Log2 count + 1 for ", cluster_name))

and dex is the condition ON or OFF

ADD REPLY
0
Entering edit mode

"Raw" counts, so you're plotting un-normalized data, hence plots have no meaning in terms of groupwise comparisons. Use the normTransform function or output of vst for plotting. That corrects for depth and composition.

ADD REPLY
0
Entering edit mode

Thank you for your reply, but it is always the same case. Showing a significant p-adj when there isn't a difference between the 2 conditions at a certain date which is mostly on day04

ADD REPLY
0
Entering edit mode
@mikelove
Last seen 10 hours ago
United States

I notice you are using betaPrior=TRUE. We have set to default and recommended betaPrior=FALSE for many years (since version 1.16 in 2017). We turned it off for a reason, especially with complex designs it was shrinking coefficients too much.

Can you adjust this first?

ADD COMMENT
0
Entering edit mode

yes i turned it off Michael Love

ADD REPLY
0
Entering edit mode

Then for the remaining genes that you don't think are DE, just plot like this:

dds_sub <- dds[,dds$condition %in% c("x","y")]
droplevels(dds_sub$condition)
plotCounts(dds_sub)

replacing condition and x,y with the appropriate words.

ADD REPLY
1
Entering edit mode

This is the result i got when i only looked on day 04 for the gene in example 1 posted above

dds_sub <- dds[, dds$date %in% c("day04")]
droplevels(dds_sub$date)
plotCounts(dds_sub,intgroup = "dex")

enter image description here

ADD REPLY
0
Entering edit mode

With 3 vs 3, when one sample increases from 50 to 5000, this can lead to rejection of null hypothesis. I'm not surprised with the above counts and that it would have a padj less than some common threshold like 0.05 or 0.1

If you want to be more stringent, we recommend lfcShrink. You can apply it to the subset e.g. dds_sub:

dds_sub <- DESeq(dds_sub)
res <- lfcShrink(dds_sub)

You can filter to genes with a large, shrunken LFC.

ADD REPLY
0
Entering edit mode

Michael Love i relaunched my deseq2 with the lfcshrink (ashr) and here i'm extracting the results between conditions (ON or OFF) for each date

 # Get unique days from metdata
unique_days <- unique(metadata$date)

# Loop through each unique day for comparison
for (day in unique_days) {
  contrast <- c("lab", paste0(day, "ON"), paste0(day, "OFF"))
  res <- results(dds, contrast = contrast)
  res_lfc <- lfcShrink(dds, res=res, type = "ashr")
  result_data <- as.data.frame(res_lfc)

  # Assign a unique name to each data frame
  assign(paste0("result_df_", day), result_data)
}

but at the end i got similar results as the previous analysis. I guess i have a huge variability between replicates that is causing false positive p-adj

ADD REPLY
0
Entering edit mode

I'll just note that with 3 vs 3, when one sample increases from 50 to 5000, it's not exactly clear what the right answer is. Should we ignore the data of the 100x increase and say it is expected under the null. The answer is more data is needed because of the high variability.

ADD REPLY

Login before adding your answer.

Traffic: 433 users visited in the last hour
Help About
FAQ
Access RSS
API
Stats

Use of this site constitutes acceptance of our User Agreement and Privacy Policy.

Powered by the version 2.3.6