Entering edit mode

For DiffBind users, there is a new function in Bioconductor 3.13, dba.plotProfile(), that makes it straightforward to calculate peak profiles and generate complex heatmap plots.
dba.plotProfile() flexibly packages different sets of sites and samples from a DiffBind analysis for the Bioconductor package profileplyr (by Tom Carroll and Doug Barrows), generating profileplyr objects that can be customized using that package, including exporting to deepTools.
A tutorial in the form of a markdown workbook is available, showing how to use the dba.plotProfile() function.
For example, using the vignette tamoxifen dataset, the following plot can be generated with one simple call:
profiles <- dba.plotProfile(tamoxifen, doPlot=TRUE)
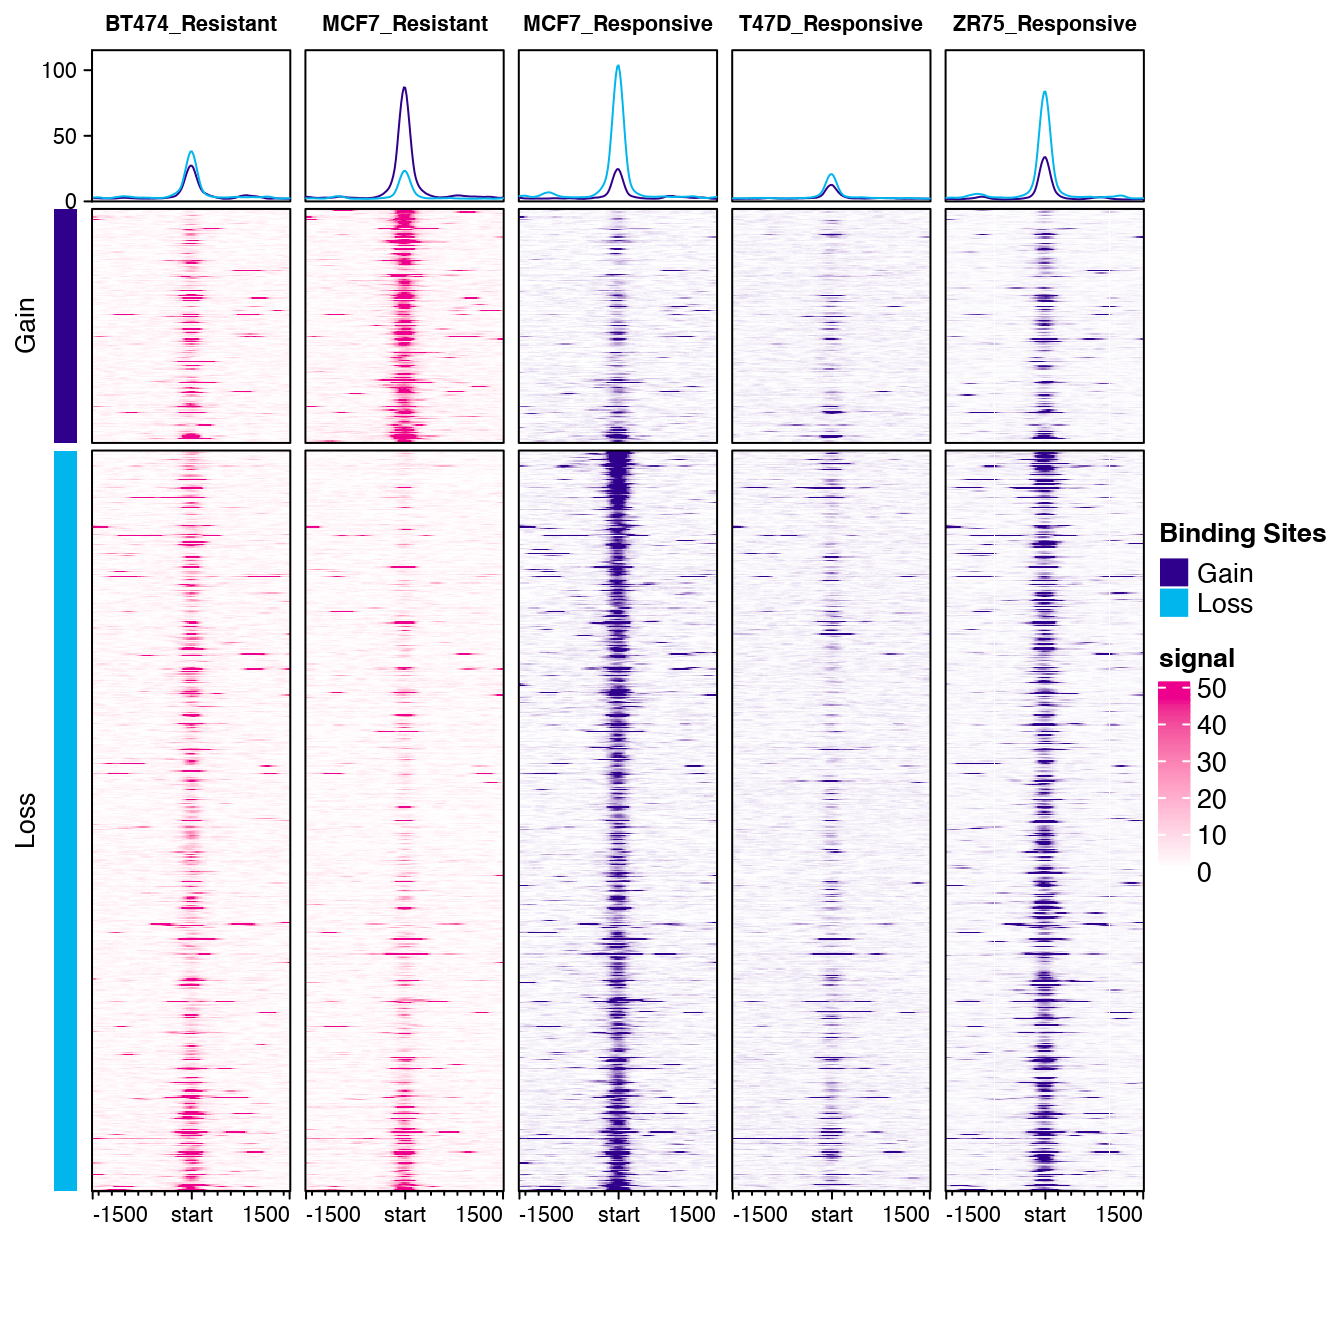
This looks great! Is there a way to adjust the +/- 1500 window size?
Yes, you have full control over the windows by passing through parameters to
profileplyr::BamBigwig_to_chipProfile(), such asstyle,distanceAround,nOfWindows, andbin_size.If you look at the tutorial linked in the original post, Section 7 explains how to control the windows.
Hi, I really appreciate your update and comments. One question - can I reverse gain and loss locations?
If you could ask this as a question on the main support forum (instead of here in
News), I'd be happy to give a detailed answer on how to do this.Thank you so much! I'll post the question there.